The monitoring stack is a Linux server toolkit for tracking and visualizing application resource usage in real time. This stack uses a set of open-source tools, including Telegraf, InfluxDB and Grafana to collect and display metrics. The monitoring stack can be used to evaluate
Magic Collaboration Studio
system usage and performance. Metrics for Java operations, database backend processes, and server resource usages can be tracked to isolate performance issues, as well as optimize system resources.
Components
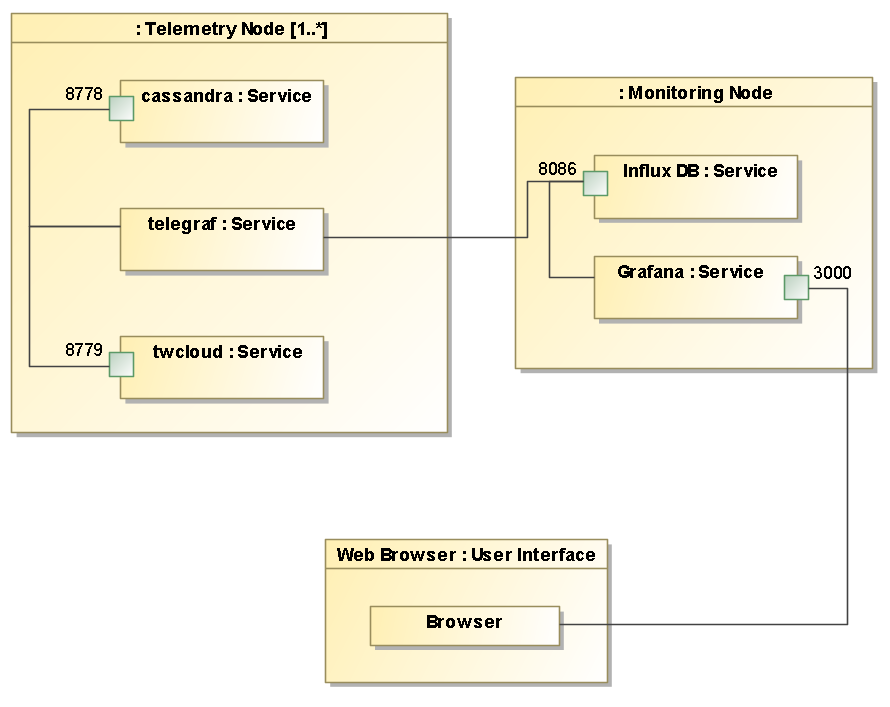
The following components constitute the monitoring node:
- InfluxDB - time series database for collecting the metric data
- Grafana - dashboard visualization layer
The following components are deployed on each Teamwork Cloud/Cassandra node:
- Telegraf - system metrics collector
- jolokia-agent-jvm, version 2.3.0 - a metrics exporter agent for Java
On a single node installation, all components may be installed on the same node. On multi-node systems, the monitoring node components may be installed on one of the nodes (or on a separate machine), while the other components are deployed on each node.
Ports
The following are default ports used by services running on the monitoring node.
Service | Default Port |
InfluxDB | 8086 |
Grafana | 3000 |