Automated installation using scripts
Downloads
Download the twc-scripts-<version>-linux-monitoring-stack.zip script package here.
Installation of the Monitoring Stack involves setting up a monitoring node and at least one telemetry node. The monitoring node consists of a database for storing metrics, Telegraf for pulling metrics from Teamwork Cloud, and the Cassandra database, with a web interface based on Grafana for real-time data visualization. The installation script installs Telegraf to stream metrics to the monitoring node. We recommend deploying the monitoring node on a dedicated server. Single-node deployment of the Monitoring Stack and Teamwork Cloud is possible, provided there are enough system resources for all components.
wget is not part of the installation script. Install it using the following command:
sudo dnf install wget -yInstalling Monitoring Stack
Single-node deployment (Cassandra, Teamwork Cloud, and Monitoring Stack installed all on the same server)
Installation of the Monitoring Stack involves downloading the monitoring stack installation scripts, running them on all nodes, and configuring visualization.
- Download and extract monitoring-stack_<version>.zip.
- Add execute permission to all .sh files extracted, if they are not set.
- Navigate to the Monitoring-Node-Install folder.
- Execute install_monitoring_node.sh inside this folder (the script will require JSON and configuration files in the folder).
- Navigate to the Telemetry-Node-Install folder.
- Execute install_telemetry_node.sh. Provide either the fully qualified domain name, or the IP address of the server.
- Stop twcloud service.
- Restart cassandra service.
- Start twcloud service.
- Proceed to import and configure the Grafana dashboard below.
Multi-node deployment (Cassandra/Teamwork Cloud on one server, and Monitoring Stack installed on a separate server)
Installation of the Monitoring Stack involves downloading the monitoring stack scripts, extracting the scripts, and then using install_monitoring_node.sh to install the monitoring stack software on that node. Then the script install_telemetry_node.sh can be run to install the telemetry software on any node with Teamwork Cloud and/or Cassandra installed.
- On the monitoring node (node that is to host the Grafana interface), download and extract monitoring-stack_<version>.zip on the monitoring node (the node with the Grafana interface).
- Navigate to the Monitoring-Node-Install folder.
- Execute install_monitoring_node.sh inside this folder (the script will require JSON and configuration files in the folder).
- Transfer the Telemetry-Node-Install folder to each telemetry node.
- On each telemetry node:
- Navigate to the Telemetry-Node-Install folder.
- Stop twcloud service.
- Execute install_telemetry_node.sh inside this folder. Provide the IP address or fully qualified domain name for the monitoring server.
- Restart cassandra service.
- Start twcloud service.
- Proceed to import and configure the Grafana dashboard below.
Importing Grafana dashboard
To set up Grafana dashboard
- Go to the Grafana home page at http://<monitoring-node>:3000 (note the HTTP address) in a web browser.
- Log in to the Grafana dashboard. Use default credentials of admin/admin for new installation; You will be prompted to change the admin password after initial login.
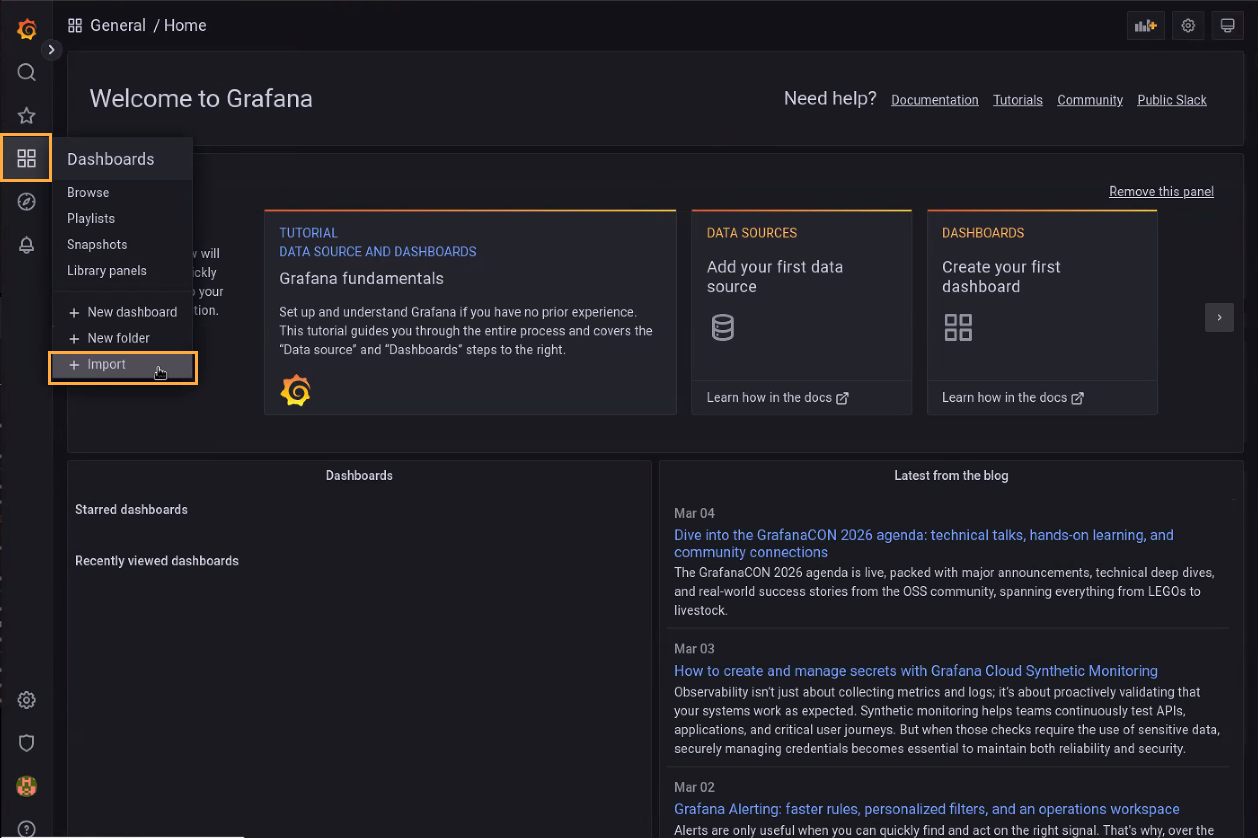
- From the home page, locate the Dashboards menu on the left menu and select Import:
- Click the Upload JSON File button. Locate and select the Grafana dashboard file called Teamwork Cloud Dashboard.json from the monitoring stack package.
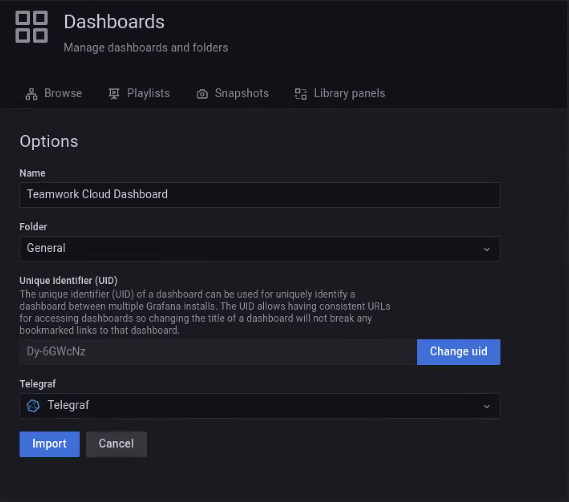
- Map the telegraf data source to Telegraf as show below. Click Import.
- To set this dashboard as the default Home Dashboard, go to Configuration and select Preferences. Select the Teamwork Cloud dashboard under Home Dashboard and save.