The following information is provided as example guidance. Grafana interface and exact procedure will differ by version.
Configuring Grafana monitoring dashboard
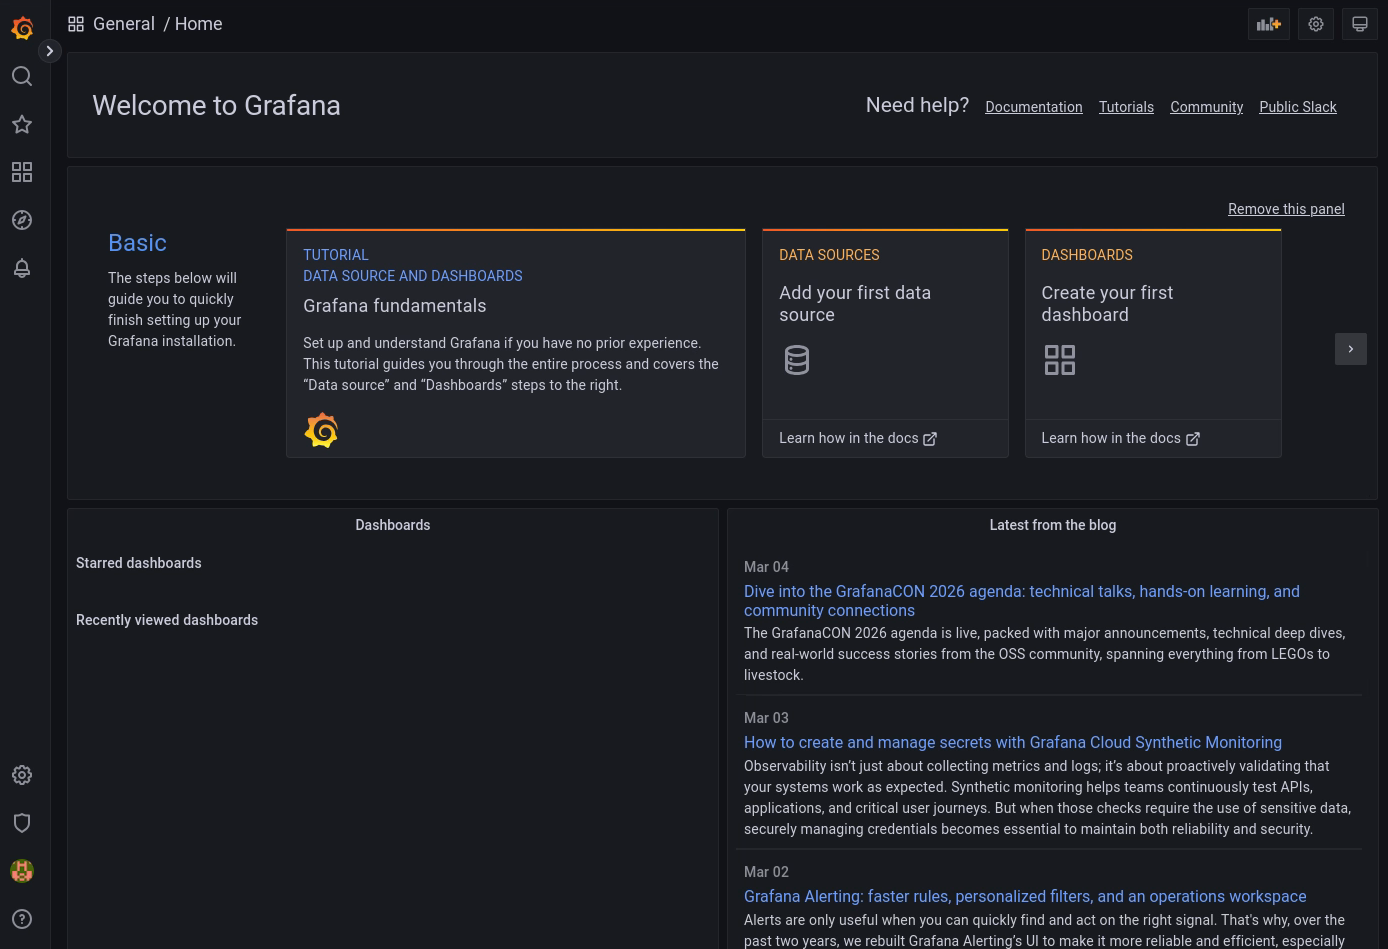
Log in to http://MONITORINGNODE_IP:3000 - you will be displayed the Grafana Login Screen - default credentials are admin/admin. Upon logging in, you will be prompted to change the admin password.
You will be presented with the following screen:
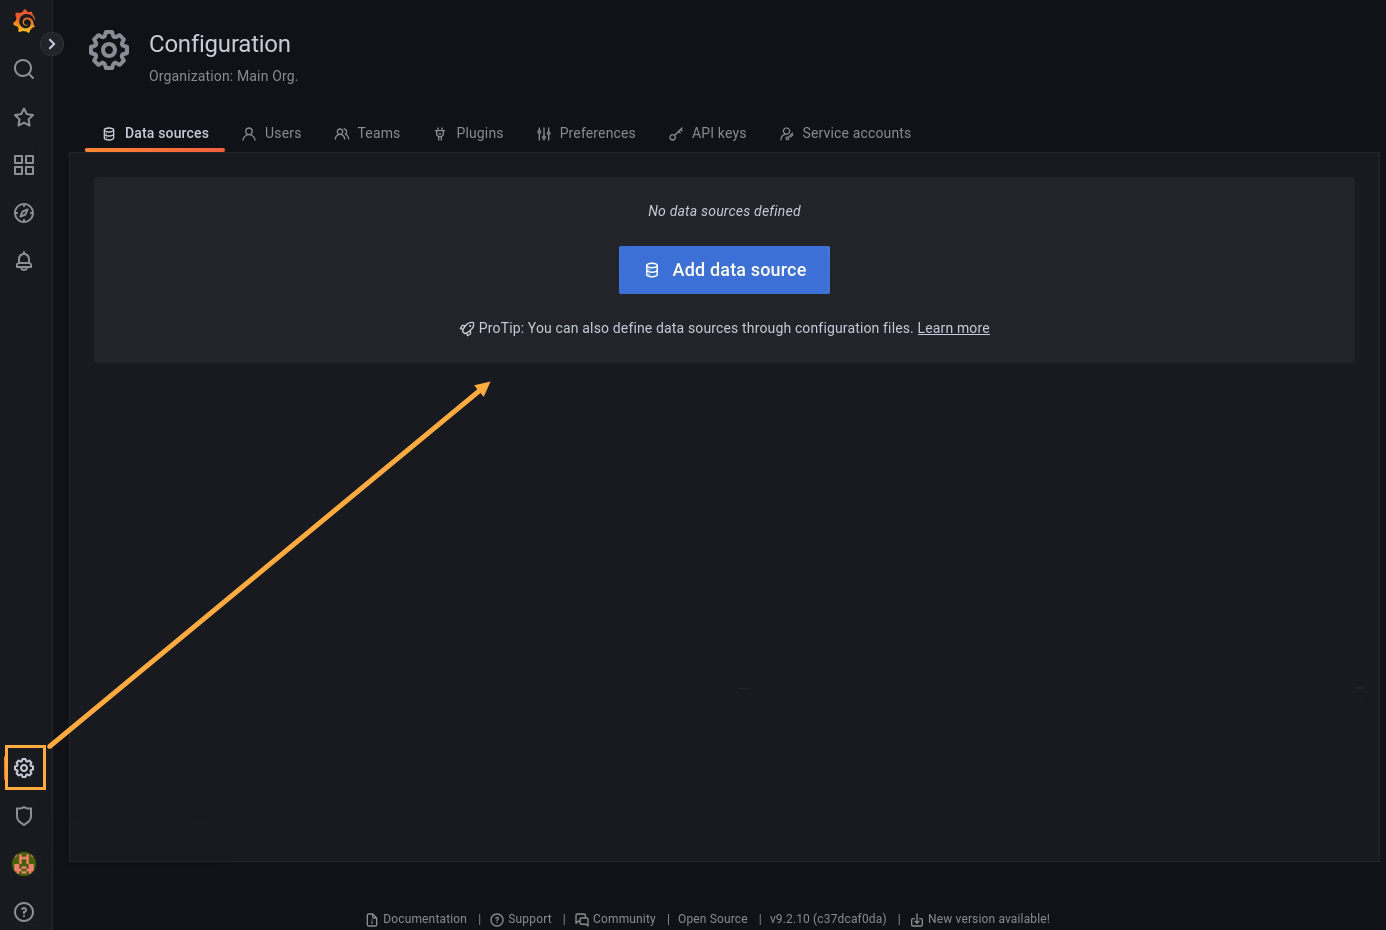
Open the Data Sources page by clicking the gear icon in the bottom left of the webpage and then clicking Data Sources. Then, click Add data source:
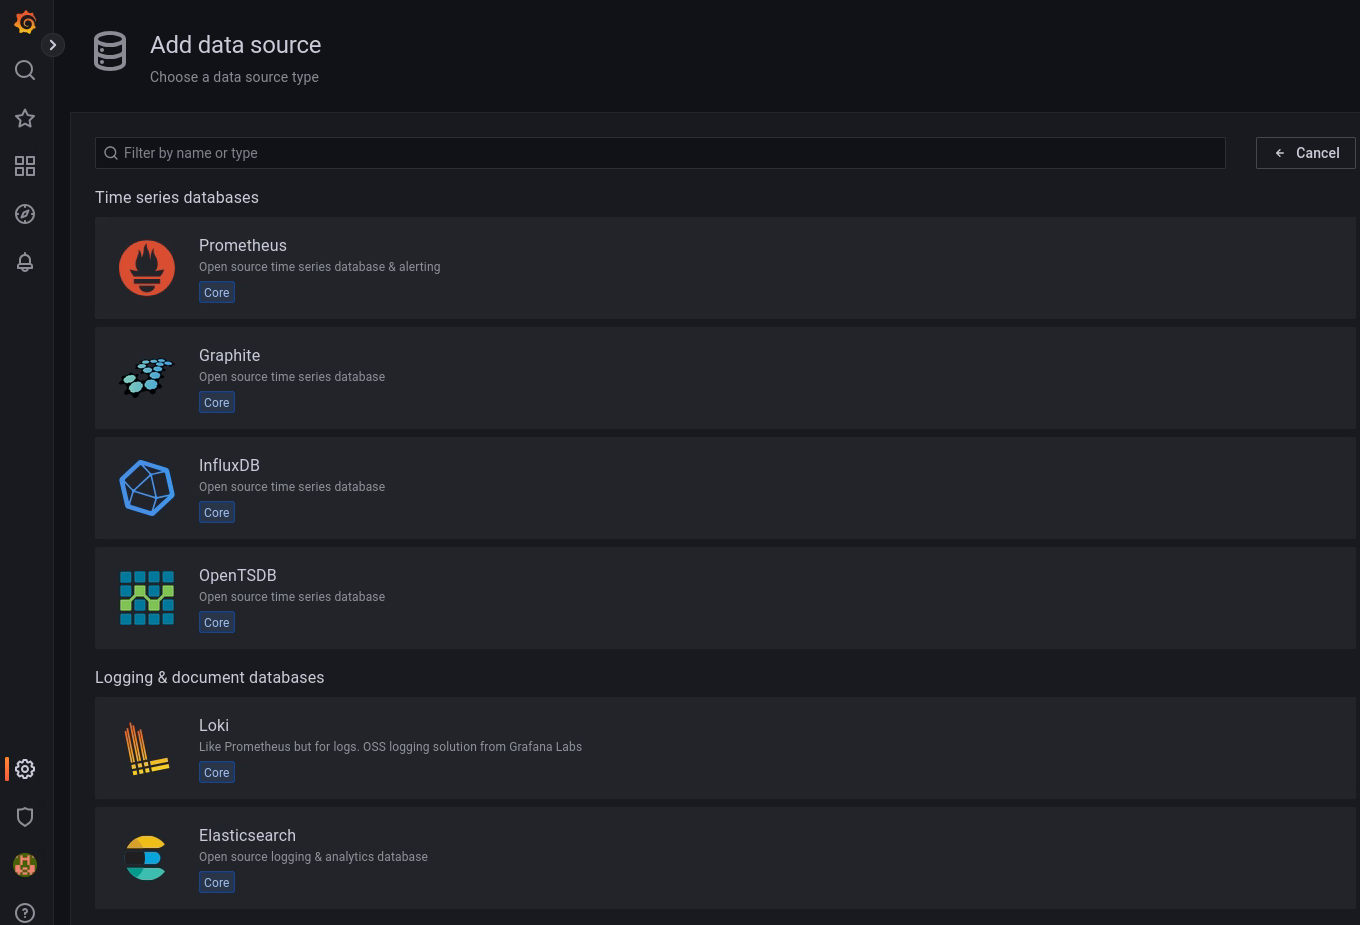
Select InfluxDB:
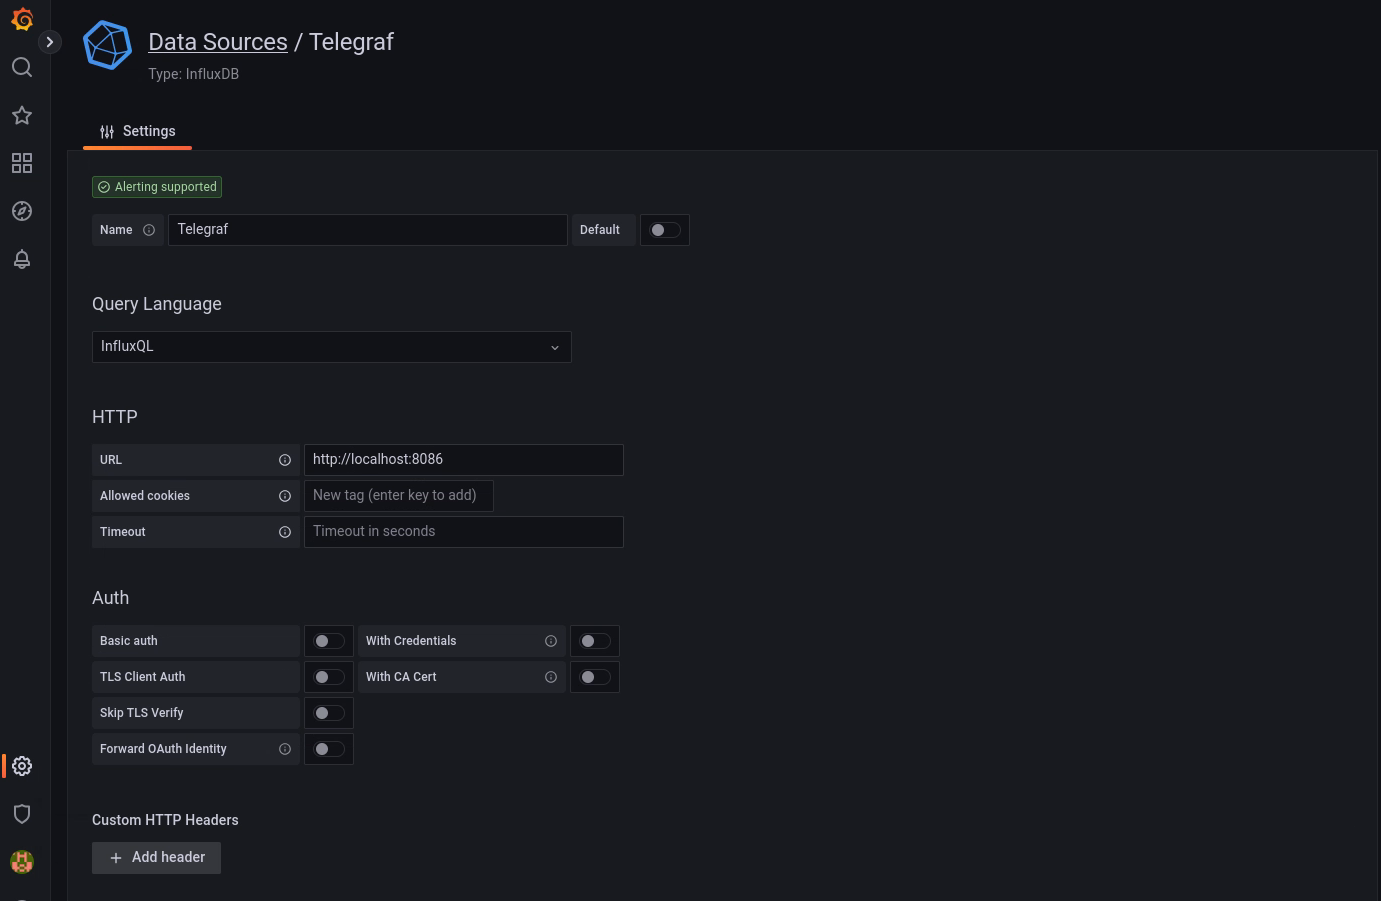
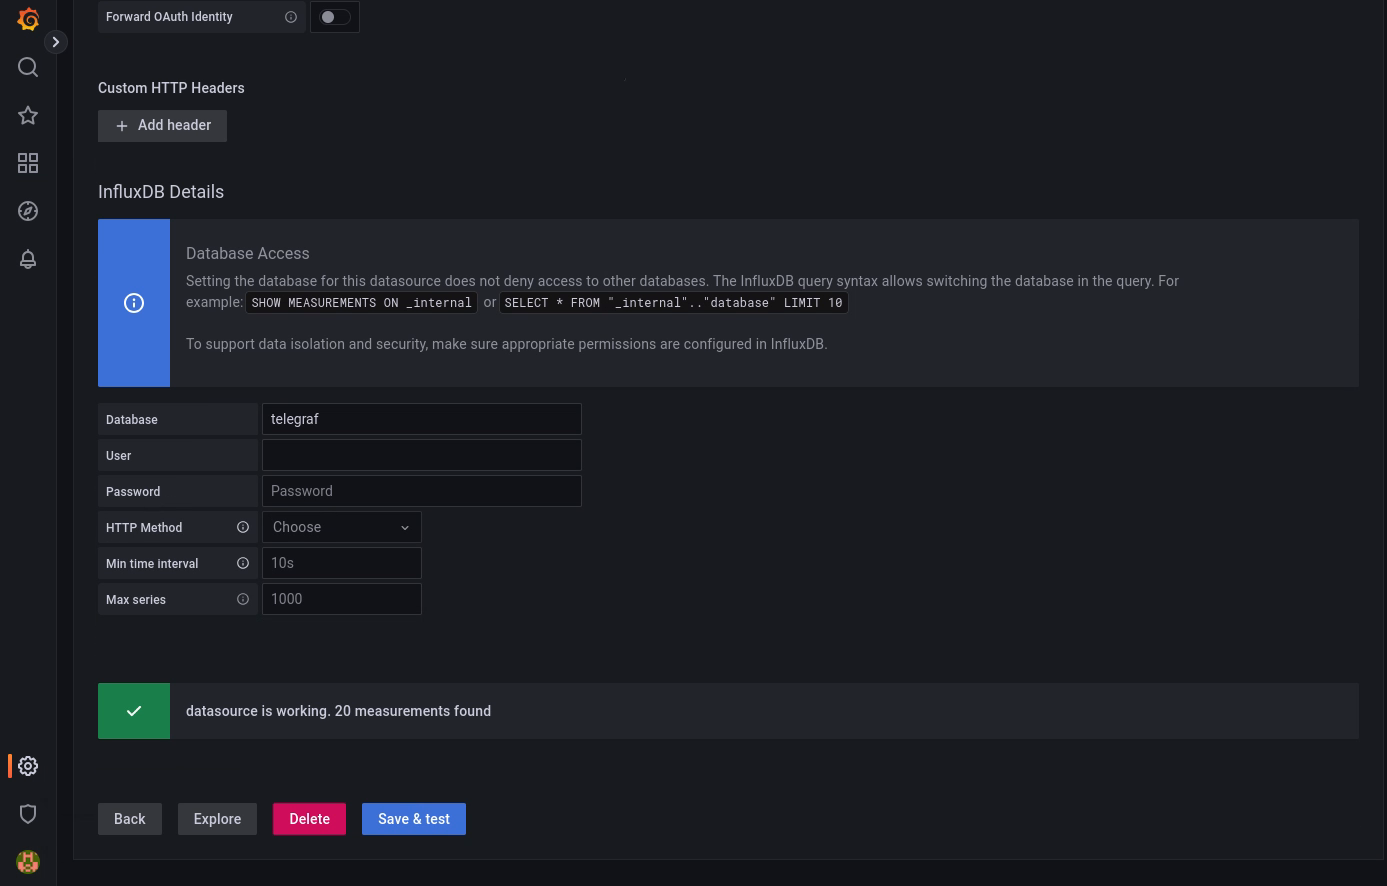
Create the data sources, enter the information as in the following screenshots, and press Save & Test for each. After the data source gets created, click the Data Sources link to continue adding data sources.
Click Save & test, then go to the next step.
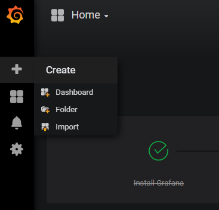
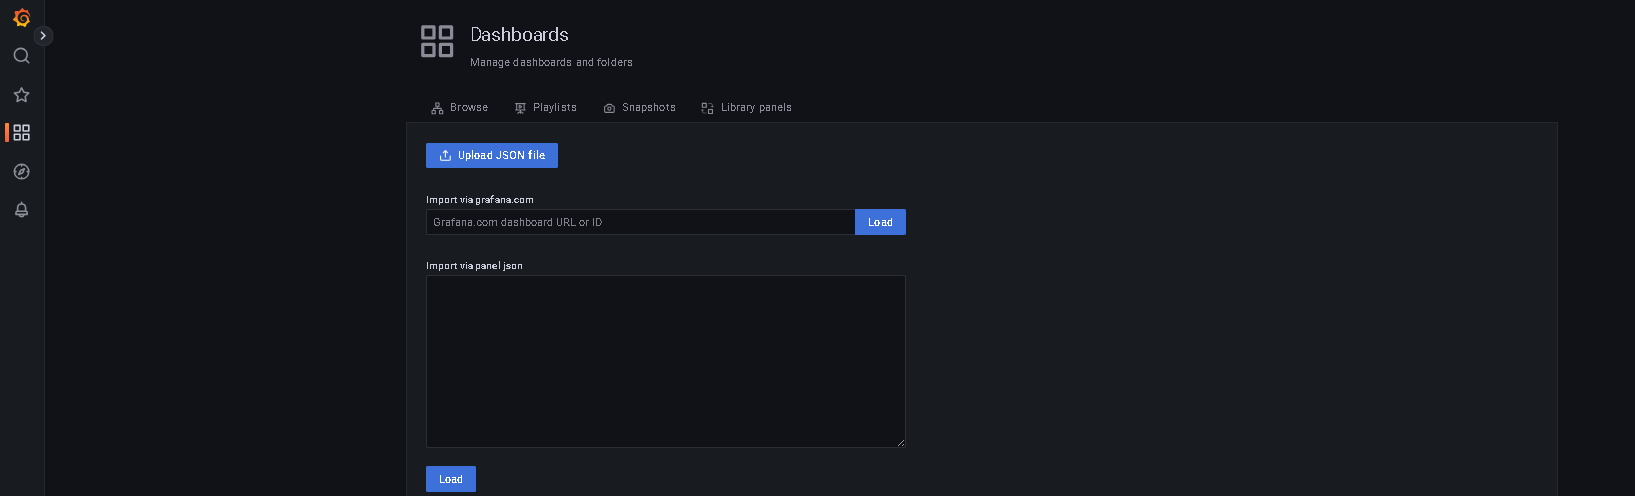
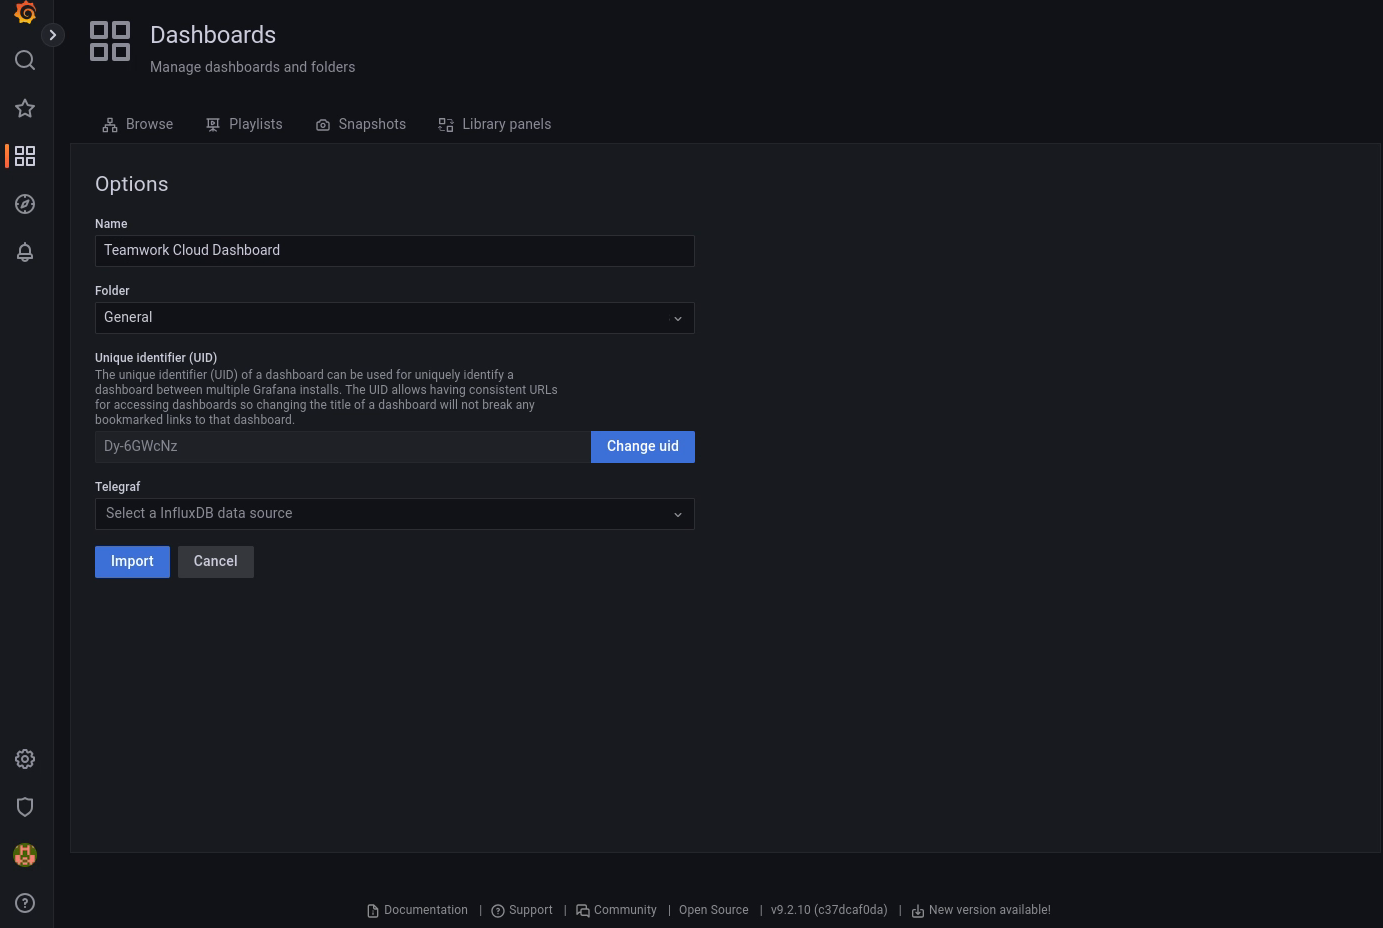
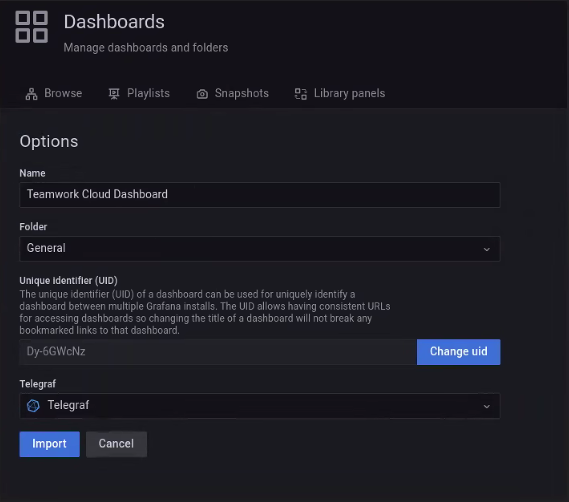
Now that the data sources have been added, select the option to import a dashboard