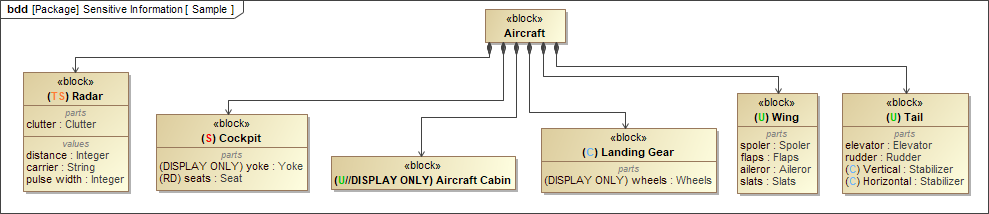
You can easily add Data Markings to your project elements via the Data Markings shortcut menu. When a Data Marking is added to an element, it is displayed as the Data Marking's portion marking in the color specified via the color representation attribute. The portion marking is displayed in parentheses as a prefix to the element name.
Adding Data Markings
Note
To add Data Markings, the elements must not be read-only.
You can add Data Markings to various elements of your project:
Diagrams (tables, matrices, maps, etc.)
Elements (relationships, blocks, packages, ports, operations, properties, comments, etc.)
Note
title
Labels
Elements and relationships whose names and/or types are displayed in labels have Data Markings added as prefixes in the labels. You can choose to show or hide the labels via Symbol Properties. Hiding the label hides the added Data Marking, too; however, it does not remove the Data Markings from the element/relationship.
Diagram image export
You can export images of diagrams (tables, matrices, maps, etc.) that contain Data Markings using the following methods:
The images are also represented in the reports generated via the Report Wizard
Info
title
Export to Excel/CSV files
If you are exporting tables with Data Markings, using Image RemovedExport will create new elements instead of importing the existing ones once the file is imported. To avoid that, make sure to use Image RemovedExcel/CSV Sync instead.