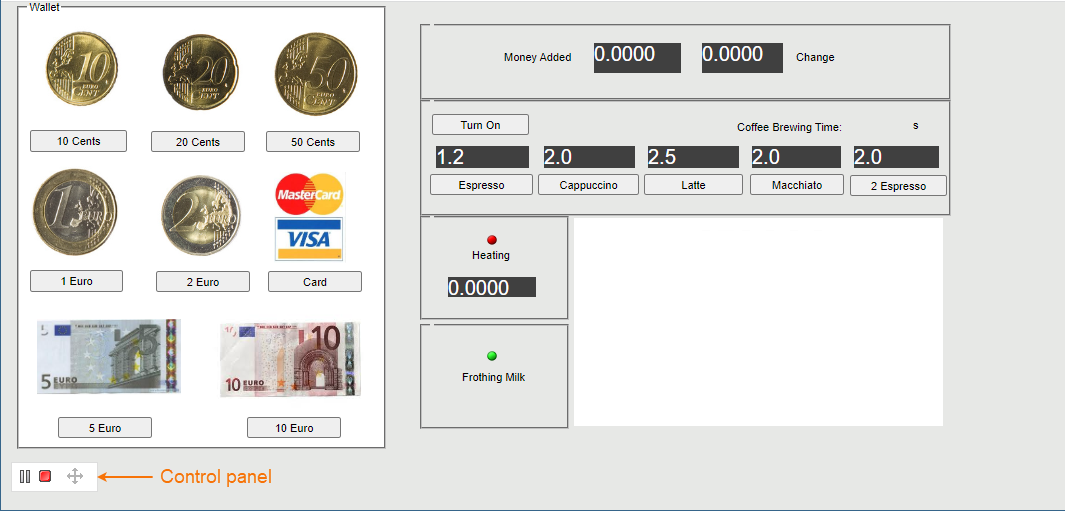
When simulating a model with aUI mockup or Time Series chart, you can open a UI window during model execution. The UI window has a control panel allowing you to start, pause, resume, or terminate the simulation, as displayed below.
A UI window with a control panel.
Note
title
Supported UI types
Server-side simulation supports the following UI types: Frame, embedded Widgets, ImageSwitcher, and Table. All of these elements must be displayed in a User Interface Modeling Diagram so you could generate and attach an HTML required for server-side simulation with UI.
To run the server-side simulation with UI
In your modeling tool, open the User Interface Modeling Diagram where the relevant UI elements are displayed.
In the diagram toolbar, click and select Generate and Attach HTML. For more information see Auto-generating HTML files.
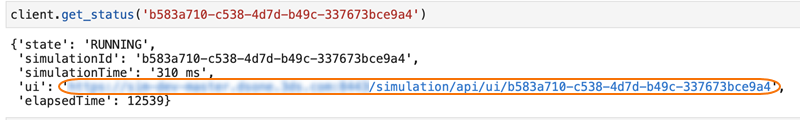
Go to the URL in the response of the status request (see the below figure) to open the first UI specified in the Simulation Configuration.
Note
To open a specific UI, add a frame name with an HTML extension at the end of the URL, e.g. /CoffeeMachine.html.
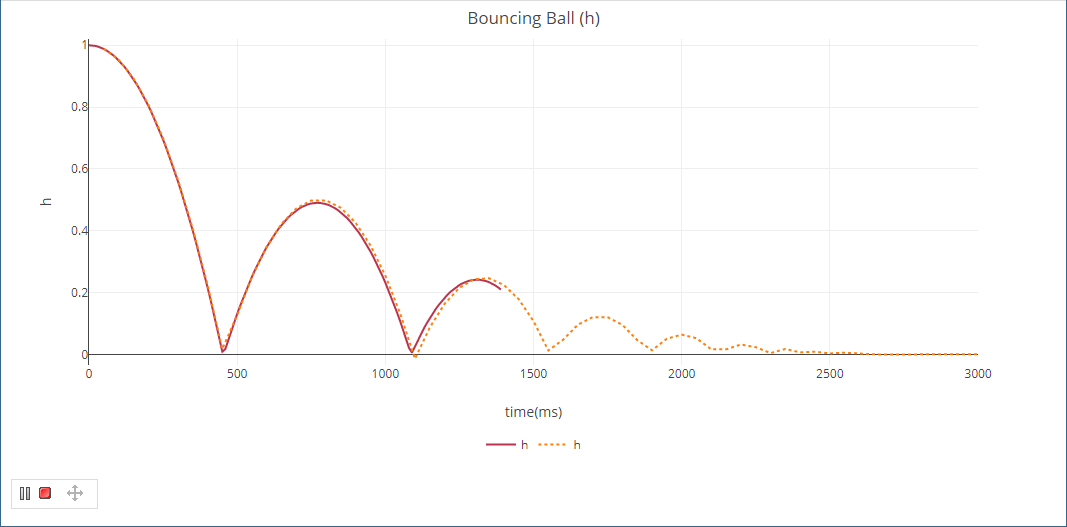
Live Time Series Charts
Server-side simulation supports live Time Series Charts. Once you start the simulation and the UI window opens, you can view theTime Series plot being updated in real-time as shown below.