This feature of Cameo Simulation Toolkit enables you to export MagicDraw HTML tables in UI modeling diagrams to HTML5, allowing them to be viewed in a web browser. The sample model used on this page, SpacecraftMassRollup, demonstrates how to create a User Interface table in the User Interface Modeling diagram, generate HTML, run the simulation, and view the UI table in HTML5 in your web browser. You can download SpacecraftMassRollup at the end of this page.
To generate an HTML table from a UI table component
Open SpacecraftMassRollup from the MagicDraw installation file: folder\samples\simulation.
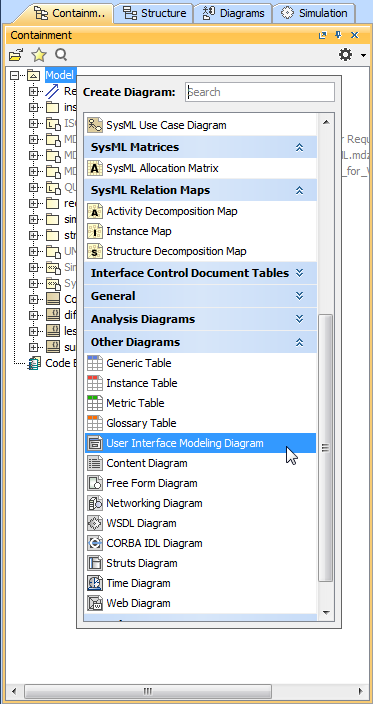
Right-click the Model element in the containment Containment tree. Select Create Diagram > Other Diagrams > User Interface Modeling Diagram.
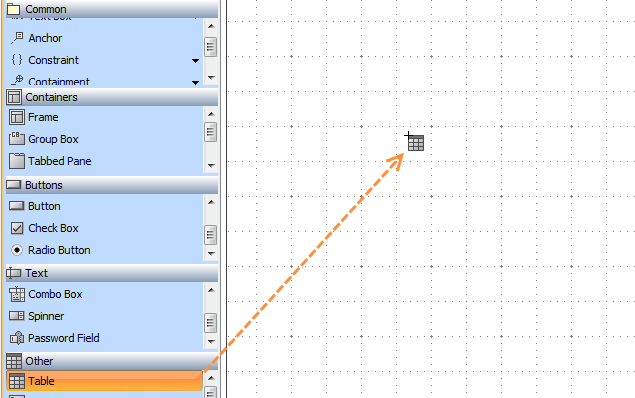
Drag a UI table component onto the newly created diagram.
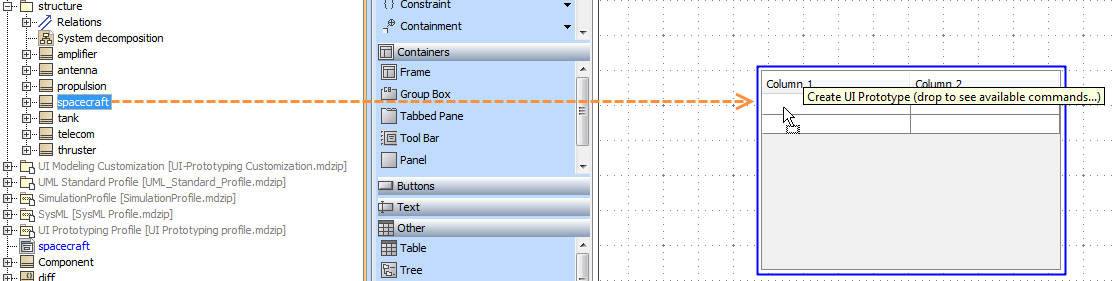
Drag the spacecraft Block from the Structure Package in the Containment tree to the table.
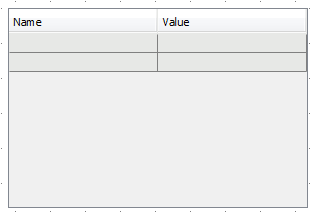
Select Create UI Prototype. The table headers will change from Column 1 and Column 2 to Name and Value.
Tip
title
Tip
If you drag the spacecraft Block to the table quickly, the column name will change automatically, without having to select Create UI Prototype.
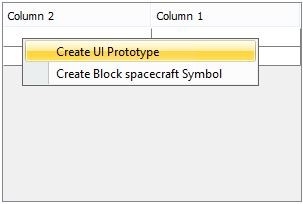
Selecting the Create UI Prototype menu that appears after dragging the spacecraft Block to the table.
When you select the Create UI Prototype, the table column names change to Name and Value.
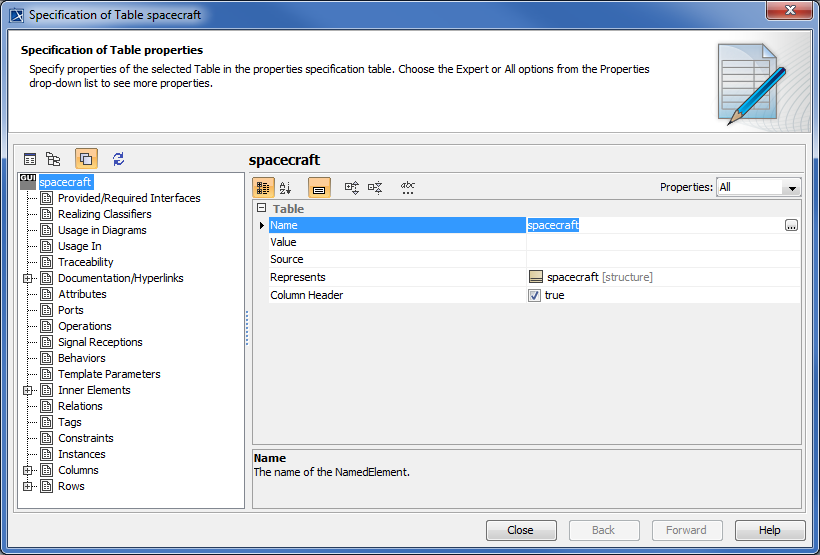
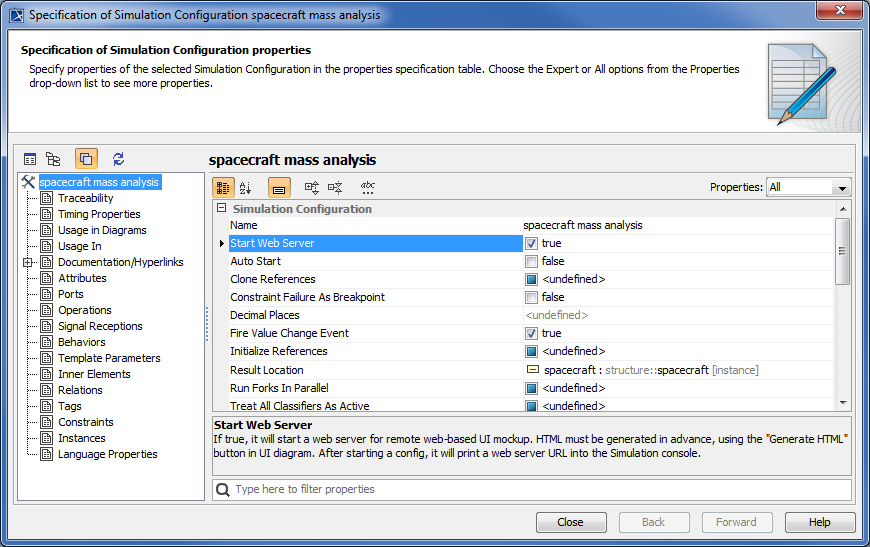
Right-click the UI table. Select Specification to bring up its Specification window as shown below. Note that the Classifier is assigned to the Represents property.
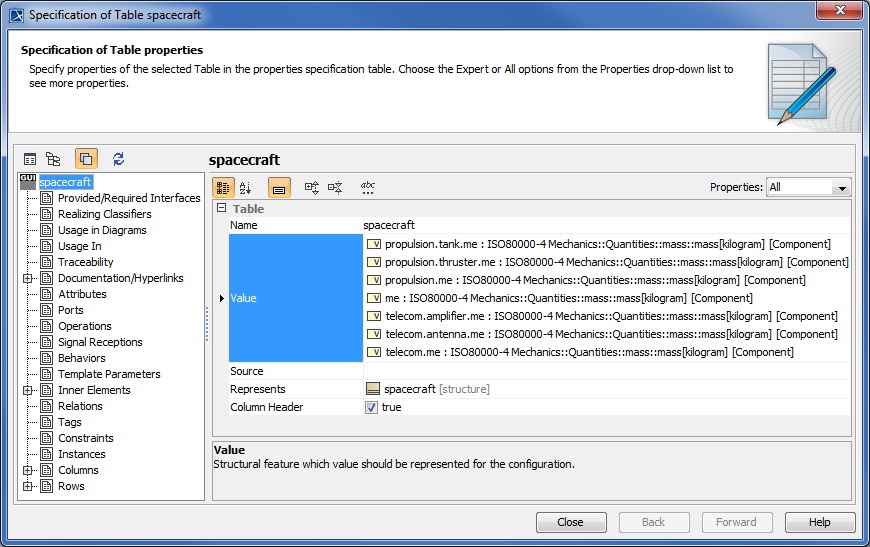
Click beside the Value property and select the values you want to monitor from the tree view in the Select Nested Properties dialog.
Click . The selected values will appear in the Value property in the UI table Specification window.
Close the Specification window.
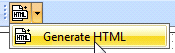
Click the Generate HTML button on the MagicDraw toolbar.
Image Added
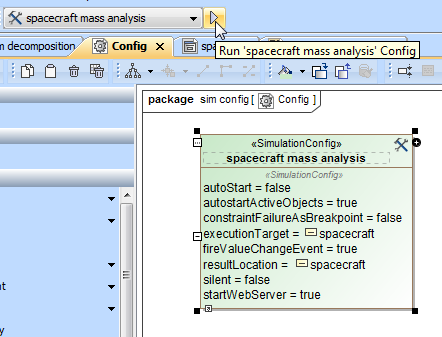
Run the spacecraft mass analysis Simulation Configuration. The Console messages will appear.
Running the spacecraft mass analysis Simulation Configuration.
Image Removed
Image Added
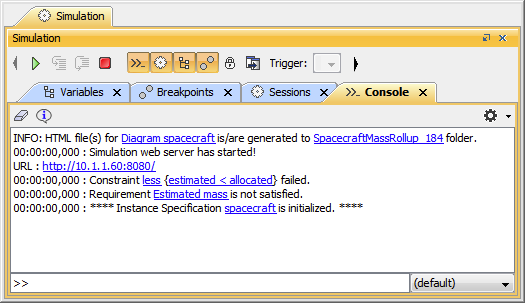
The Console messages appearing in the Simulation Console with the filter Options set to Warn.
Note that a simulation web server has started. You can open the Specification window of Simulation Configuration to see the Start Web Server (true) option.
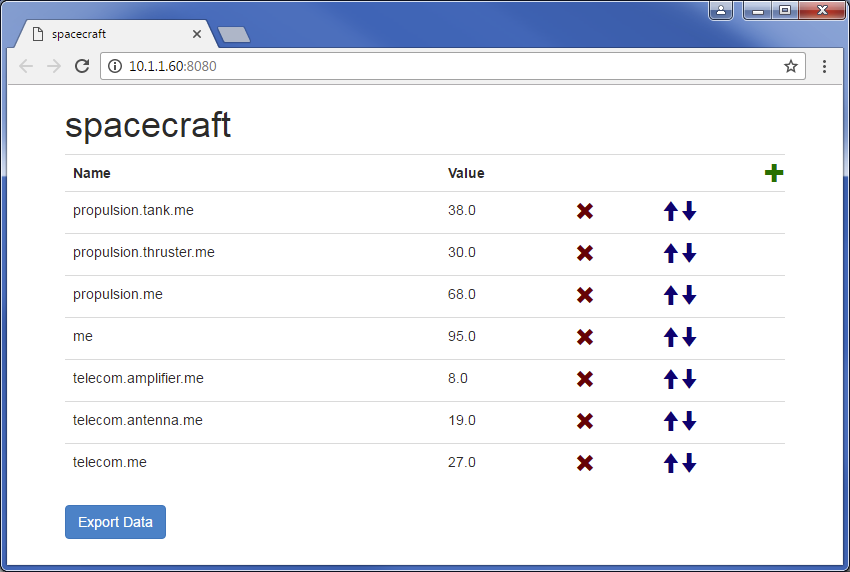
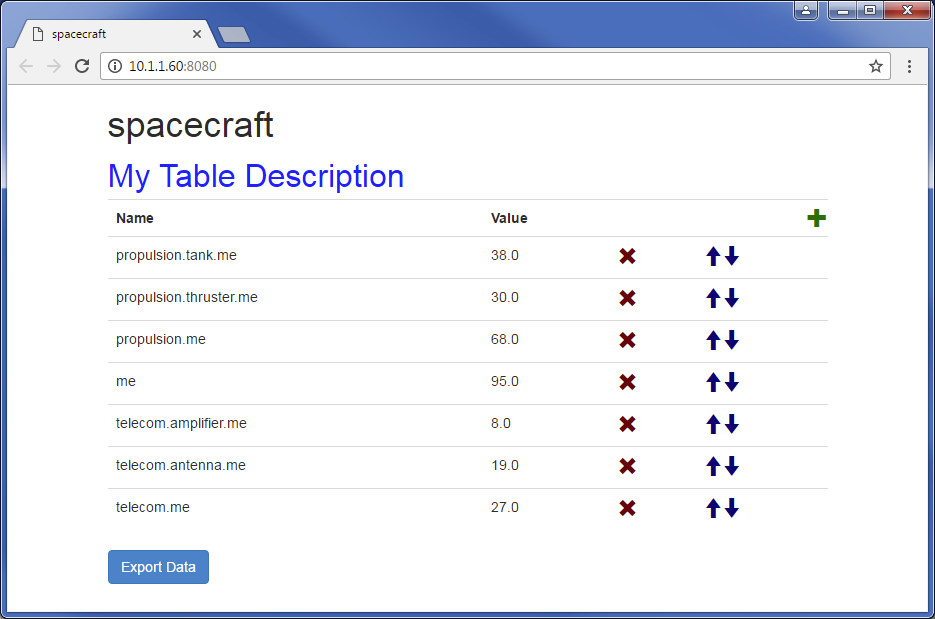
Click the HTTP link, e.g., http://10.1.1.6460:8080/ in the Console pane to view the simulation in real-time in your browser.
Note
title
Note
The preferred browser is Google Chrome.
Image Added
You can edit
the
the values from the web browser page; the simulation engine will automatically pick the values up and re-calculate.
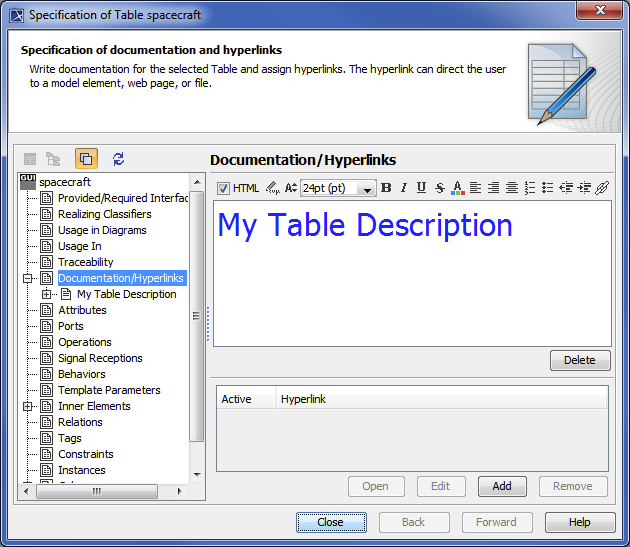
If you edit the Documentation/Hyperlink
tag
tag from the UI table's
Specification
specification window and run the simulation again
. It
, they will show up as the table's descriptions. See the following two figures
Image Removed
Image Added
Changing the Documentation/Hyperlinks tag will reflect on the table's descriptions in the browser.
Image Removed
Image Added
The changes to the Documentation/Hyperlinks tag appearing as the HTML table's description.
You can edit the values from the web browser page. The simulation engine will automatically pick the values up and re-calculate. In addition, verification status of runtime values is supported and shown that there is constraint failure, which is colored in red
HTML tables are supported for Time series charts and CSV Export configurations.
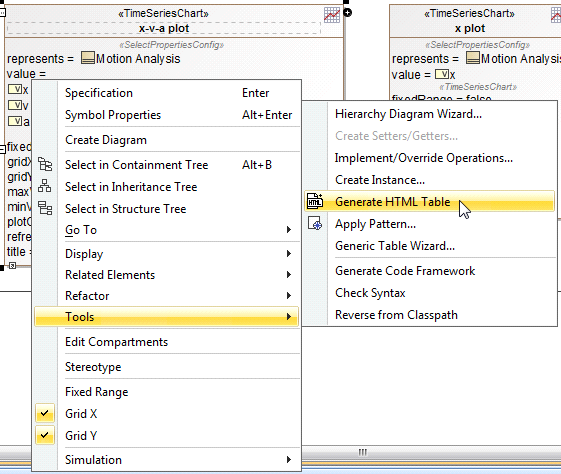
Generating an HTML table from a Time series chart and CSV export configuration
An HTML table can also be generated from a Time series chart and CSV export configuration.
To generate an HTML table from either a Time series chart or a CSV export configuration
Right-click a Time Series Chart or a CSV Export configuration and choose Tools > Generate HTML Table.
This will generate an HTML file, which can be viewed either online or offline. A message stating, "INFO: HTML table(s) is/are generated to the C:\Users\Downloads\CoffeeMachine_test1 folder, " in the Console pane will appear in the Simulation Console pane.
Sample model
The model used in the figures on this page is the SpacecraftMassRollup sample model that comes with your modeling tool.