The following components are deployed on each TWC/Cassandra node:
Telegraf - system metrics collector
Dropwizard metrics-graphite-3.1.2.jar - metrics publishing agent for Java
Install Telegraf
Install Telegraf in the TWCloud/Cassandra node
If you have not created the influxdb.repo as in step 1a of the Monitoring Mode, do so at this time.
Install with the command
Code Block
language
text
sudo yum install telegraf
Edit /etc/telegraf/telegraf.conf as follows
Locate the section titled "[[outputs.influxdb]]"
Edit the line with the urls = tag as follows:
Code Block
language
text
urls = ["http://monitoringnode_ip:8086"] where monitoringnode_ip is the IP address of the node where infuxdb is installed (if it is located on the same machine, you may use 127.0.0.1).
Copy metrics-graphite-3.1.2.jar to /usr/share/cassandra/lib/
Edit /etc/cassandra/default.conf/cassandra-env.sh, adding the following at the bottom:
Code Block
language
text
# Enable metrics reporting to InfluxDB using the yammer library
METRICS_REPORTER_CFG="metrics-reporter-graphite.yaml"
JVM_OPTS="$JVM_OPTS -Dcassandra.metricsReporterConfigFile=$METRICS_REPORTER_CFG"
Create fie /etc/cassandra/default.conf/metrics-reporter-graphite.yaml with the following content:
Replacing HOST_NAMEwith the Cassandra node's host name, and IP_ADDRESSwith the IP address of the monitoring node (where influxdb is installed)
Restart Cassandra
Code Block
language
text
sudo service cassandra restart
Configure Grafana
Configuring Grafana monitoring dashboard
Log into http://MONTORINGNODE_IP:3000 - you will be displayed the Grafana Login Screen - default credentials are admin/admin. Upon logging in, you will be prompted to change the admin password.
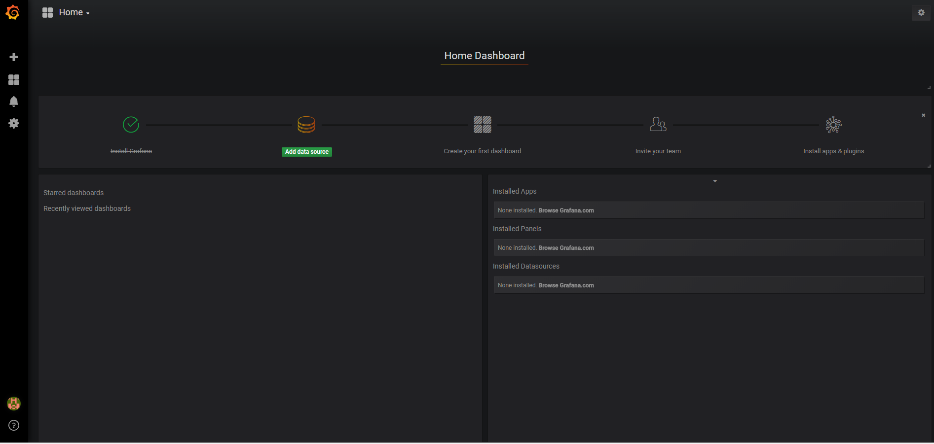
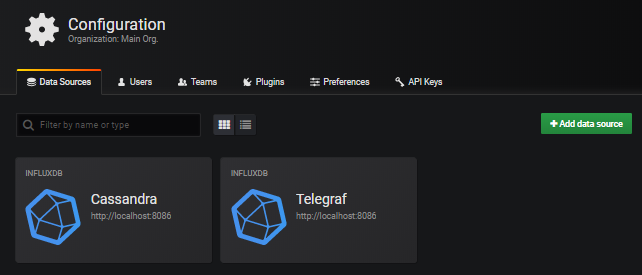
You will be presented with the following screen, click Add data source:
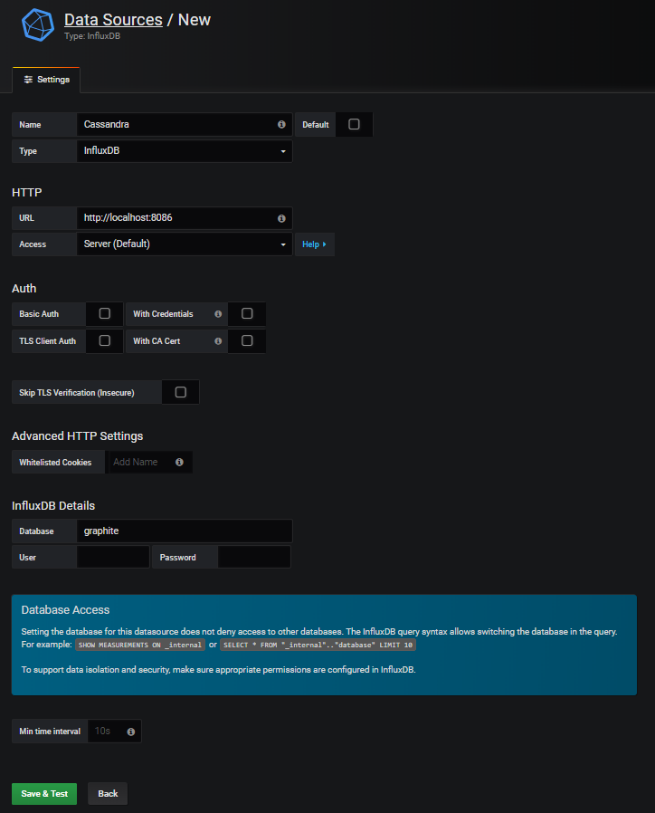
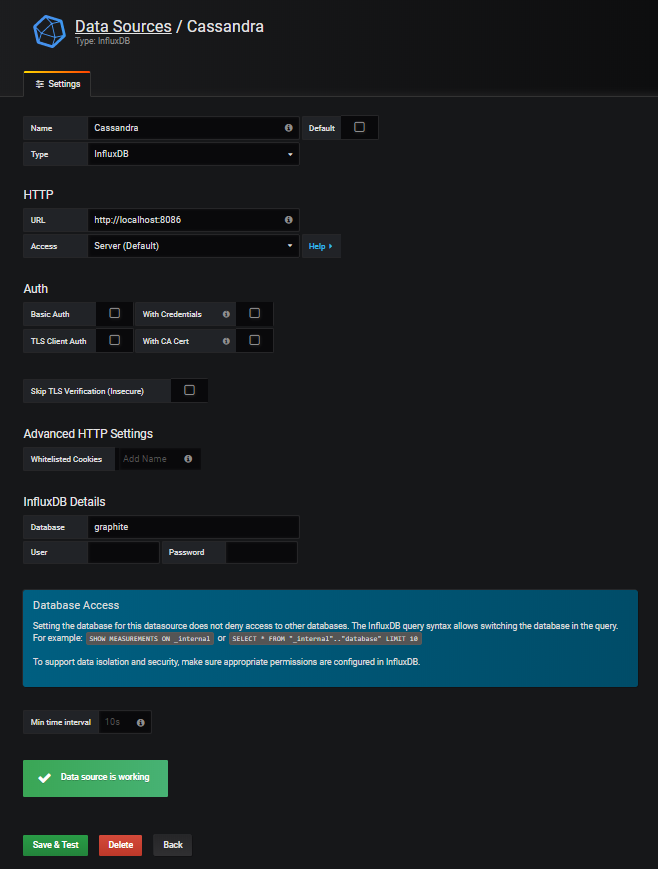
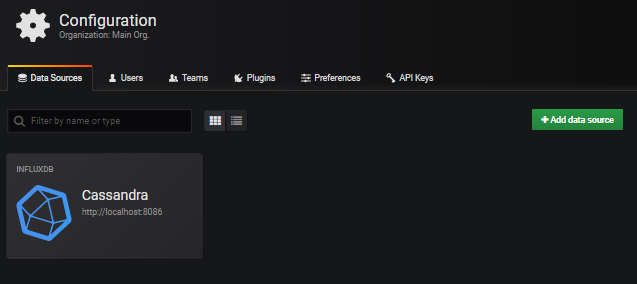
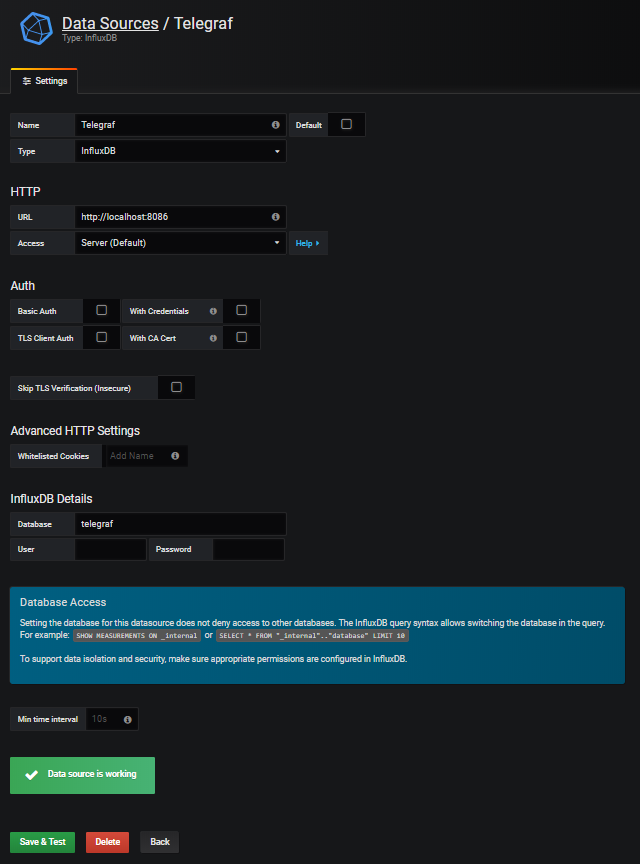
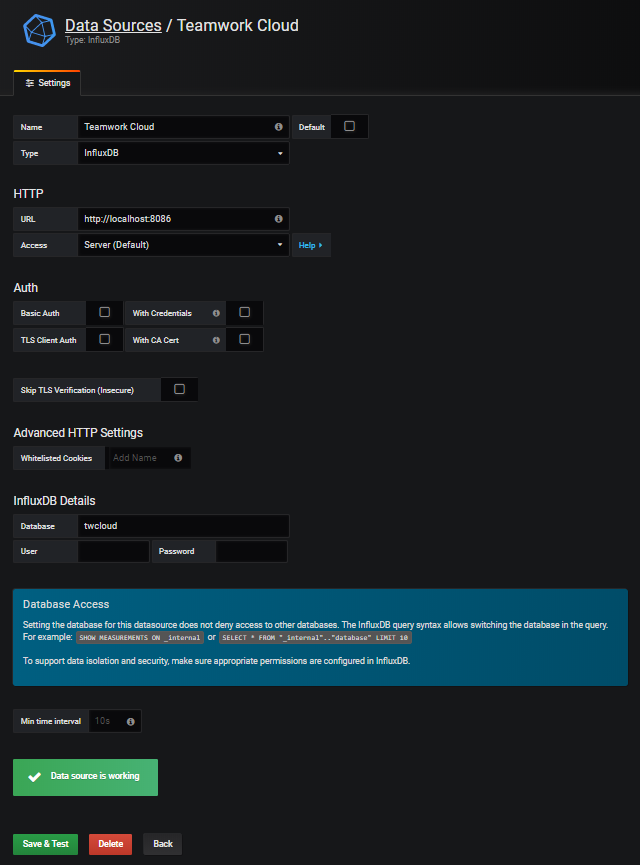
Create the data sources, entering the information as in the following screenshots, and pressing Save & Test for each. After the data source gets created, click the Data Sources link to continue adding data sources.
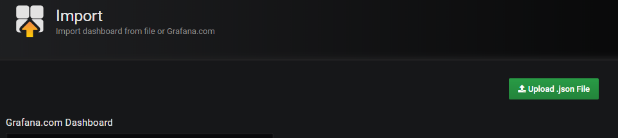
Now that the data sources have been added, select the option to import a dashboard
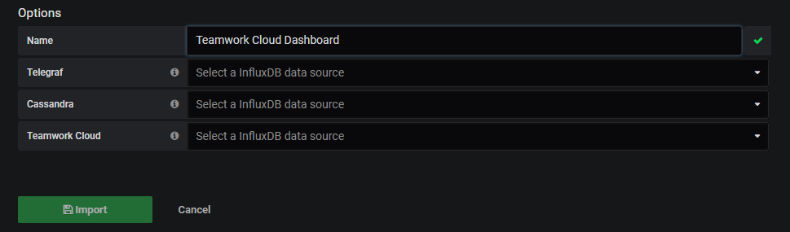
At this point, you will be presented with the following screen, in which you will need to map the data sources
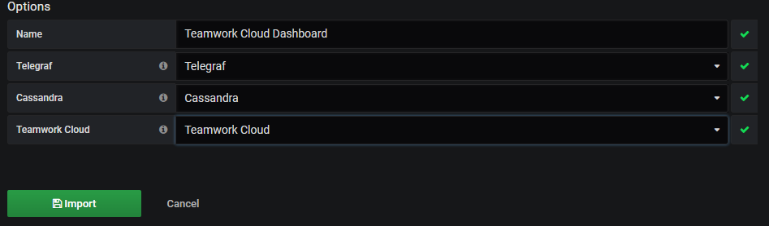
Map the data sources as shown below and click the Import button
To make the Teamwork Cloud dashboard your home dashboard, perform the following steps:
Mark the Teamwork Cloud Dashboard as a favorite
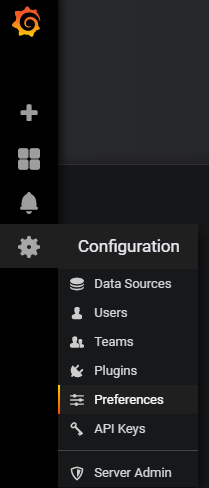
Select Configuration > Preferences
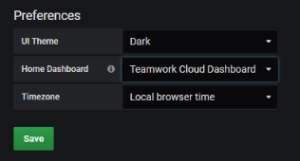
Select the Teamwork Cloud Dashboard to be your Home Dashboard and click Save.
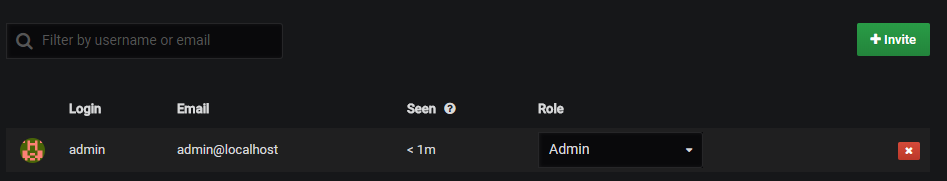
The admin user has permissions allowing full access. Create a limited access user which will be allowed of viewing the dashboard without the ability of making modifications. Click Users.
You will be presented with the following screen. Click Invite
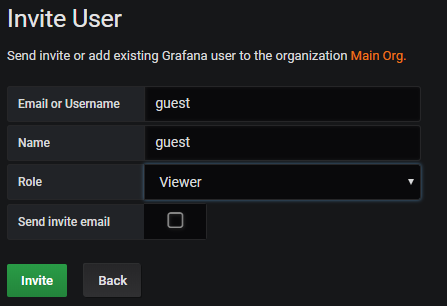
Create a guest user by entering the information as below, and clicking Invite
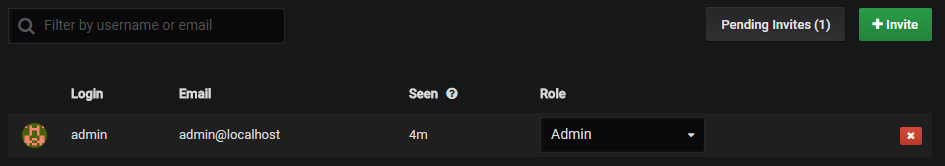
You will be shown a screen as below. Click the Pending Invites button
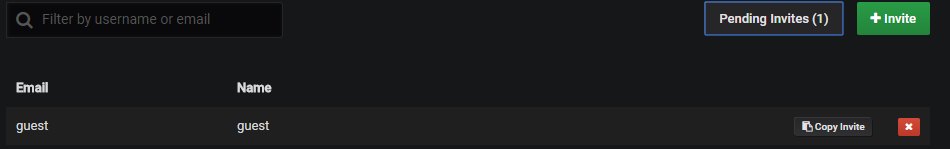
Click the Copy Invite button
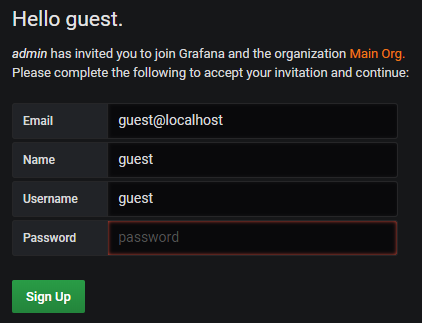
Paste the link which was copied to your clipboard on a new browser window, and replace "localhost" with the IP address of the monitoring node. You will be presented with the following screen. Change the email field from "guest" to "guest@localhost", enter a password and click on the Sign Up button. At this point, you will be redirected to the Grafana dashboard under the new login. Sign out, and sign back in as admin.