Non-normative extensions to SysML considered for standardization in future versions of the language consist of stereotypes and model libraries and are organized by major diagram types, which are consistent with how the main body of this specification is organized.
Distribution Extensions
A Distributed Property is a property of a Block or a Value Type used to apply a probability distribution to the values of the property. Specific distributions can be defined by applying a Subclass of the «DistributedProperty» stereotype to a property according to OMG SysML 1.4, E.7 Distribution Extensions.
To set a distributed property
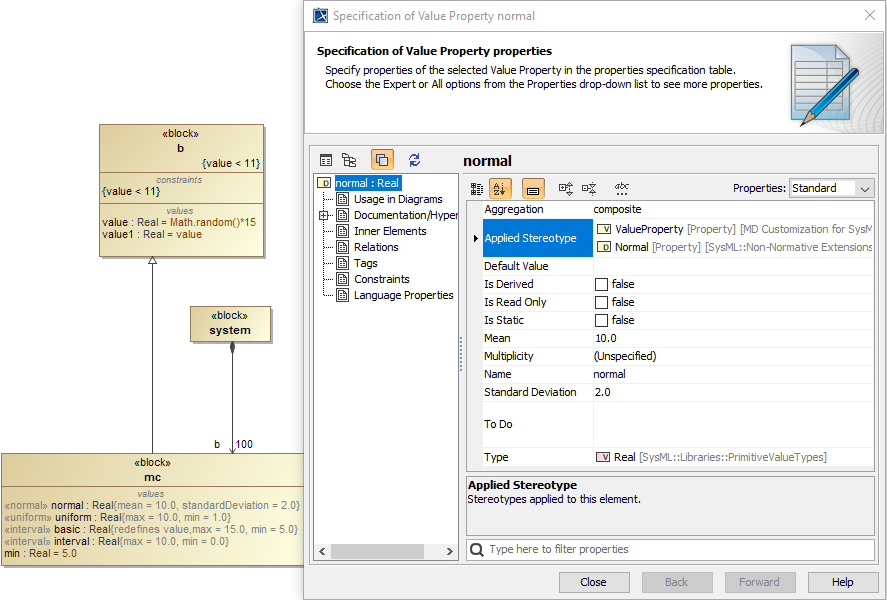
Select a property and double-click it to open the Specification window.
Select Applied Stereotype and click [...] to include a distribution property as needed.
Specify the required properties, e.g. Mean and Standard Deviation (SD) for «normal» or Min and Max for other distributed properties as shown in the figure as follows
Setting a normal distribution with mean = 10, and SD = 2.
Click Image RemovedClose. The distributed property will be applied.
Run the simulation model. Depending on the applied stereotype, the distributed properties will be initialized with a random value, e.g. normal distribution, constant distribution between min & max value. You can review sampling results by running the model with association end multiplicity, e.g. 100, and keep the result with «CSVExport» for analysis.
Results of the distributed property
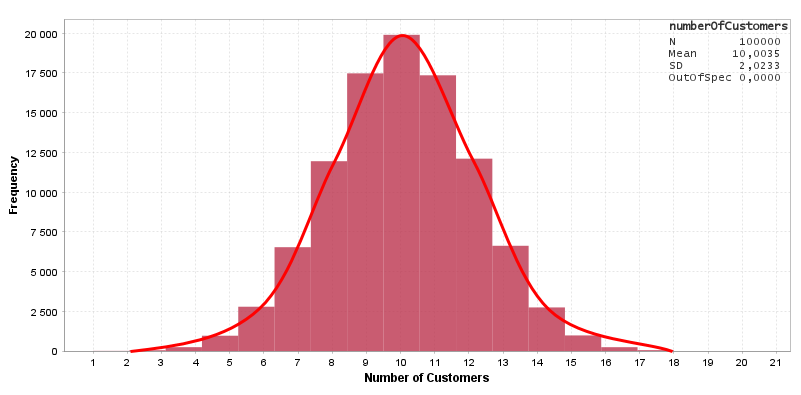
“normal”
«normal» (with
500
100000 samples)
can be plotted as a normal distribution via MATLAB or other tools as shown in the figure as follows
Image Removed
A normal distribution plotted via applying «normal» distributed property stereotype.
with a Mean value of 10 and a Standard Deviation value of 2.
Image Added
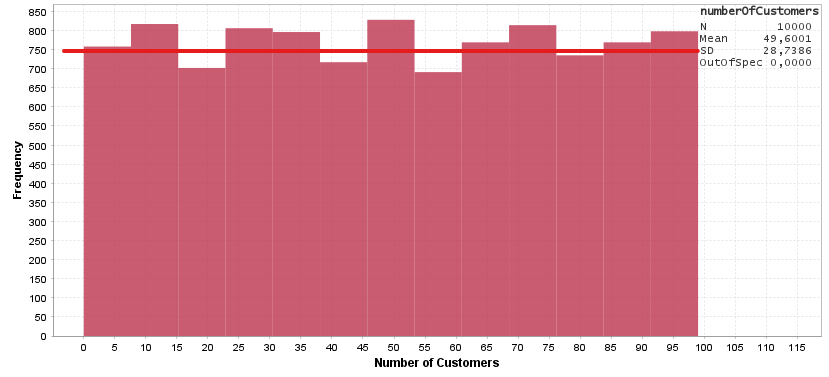
You can apply a «uniform» distributed property stereotype with Min and Max properties (e.g.
1
, 0 and
10
100)
that you can
to plot
as
a uniform distribution
as shown in the figure as follows
Image Removed
A uniform distribution plotted (Min = 1, and Max = 10).