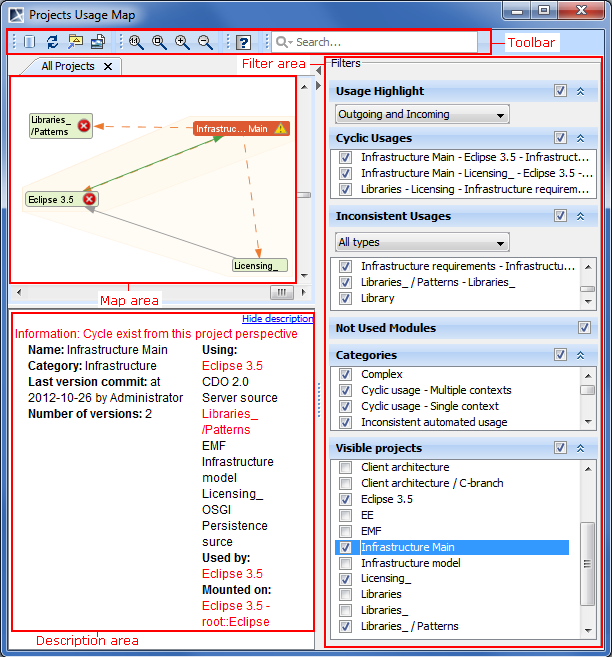
In the Project Usage Map window, you can analyze the contents of the entire Teamwork Server repository, as well as individual projects. You can explore the displayed projects and analyze both project usages and identified problems.
Project Usage Map window.
Toolbar
Toolbar element
Description
Open All Projects Map
Click this button, if you closed the All Project view in the Project Usage Map. This button is unavailable if the All Project view is opened.
Refresh
Click this button if you want to see the latest version of the repository view. All the layouts and filters will be reset.
Export To Model
Click this button to export an active usage map view to the Class diagram. You can save the exported usage map for the later comparison of the latest version.
Copy as BMP Image
Click to copy the active usage map. The usage map view is copied to the clipboard. You can paste it in any image editor.
Filter Area
Window element
Description
Usage Highlight
Select which usages you want to highlight: incoming, outgoing, or both.
Cyclic Usages
Select which cyclic usages you want to be displayed in the map view.
Inconsistent Usages
Select which type of inconsistent usages you want to be displayed.
None
Select if no inconsistent usages should be displayed.
Version
Select if you want to see version inconsistencies.
Branch
Select if you want to see branch inconsistencies.
Mount Point
Select if you want to see mount point inconsistencies.
Unconfirmed
Select if you want to see unconfirmed usage inconsistencies.
All Types
Select if you want to see all type inconsistencies.
Not Used Modules
Select if you want to see only the projects with not used modules.
Categories
Specify the particular categories of projects.
Visible Projects
Select the projects you want to be displayed in the map. By default, all the projects are selected. Right-click in the Visible Projects list area and select Show all or Hide all. Press the Delete key to unselect a project.
Description Area
See the information of the selected project. All the problems are marked in red.
Map area: understanding the contents
The representation of the selected project, incoming and outgoing usages is depicted in the following figure.
An orange arrow represents outgoing usages. A green arrow represents incoming usages.
The representation of the Sharing usage is depicted in the following figure by the solid grey arrow.
The representation of the Non-sharing usage is depicted in the following figure by the dashed gray arrow.
The representation of a Not converted project is depicted in the following figure.
The representation of Cyclic usages is depicted in the following figure.
The representation of a branch or version inconsistencies is depicted in the following figure.
The representation of the mount point inconsistencies is depicted in the following figure.
The representation of Unconfirmed usage is depicted in the following figure.
The representation of Unused modules is depicted in the following figure.