Page History
| Content layer | |||||||||||||||||||||||||||||||||||||||||||||||||||||||||||||||||||||||||||||||||||||||||
|---|---|---|---|---|---|---|---|---|---|---|---|---|---|---|---|---|---|---|---|---|---|---|---|---|---|---|---|---|---|---|---|---|---|---|---|---|---|---|---|---|---|---|---|---|---|---|---|---|---|---|---|---|---|---|---|---|---|---|---|---|---|---|---|---|---|---|---|---|---|---|---|---|---|---|---|---|---|---|---|---|---|---|---|---|---|---|---|---|---|
| |||||||||||||||||||||||||||||||||||||||||||||||||||||||||||||||||||||||||||||||||||||||||
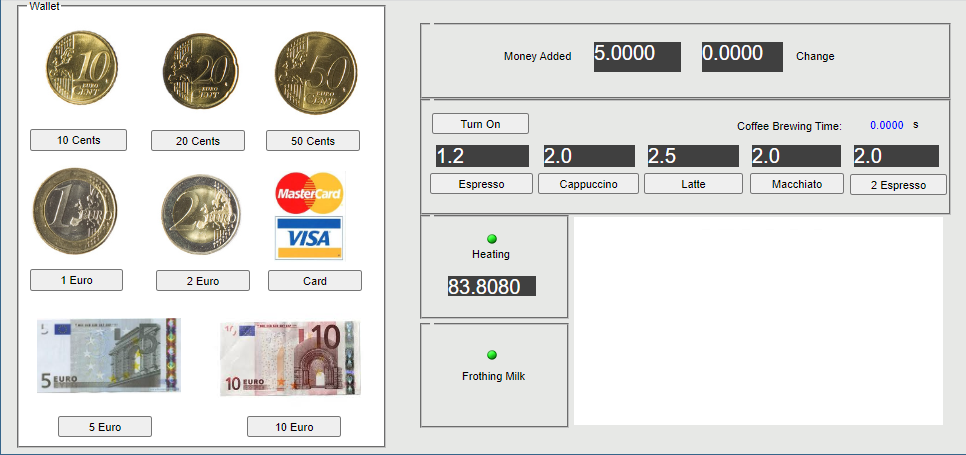
To run the Coffee Machine sample and open the HTML UI window
The HTML UI window opened during the Coffee Machine project execution.
|

| Note | ||
|---|---|---|
| ||
| Add the Spacecraft Mass Rollup sample project to the Teamwork Cloud server. |
To run the Spacecraft Mass Rollup sample with input and output parameters
- Do one or both of the following:
- Specify a set of input parameters with values to be provided for the simulation.
Specify a set of output parameters to be obtained after the simulation is complete. If no output parameters are specified, all initialized values are returned.
Code Block title Request example for running the simulation with input and output parameters parameters = { "inputs": { "propulsion.thruster.me":32 "telecom.amplifier.me":15 }, "outputs": [ "me", "propulsion.me", "propulsion.tank.me", "propulsion.thruster.me", "telecom.me", "telecom.antenna.me", "telecom.amplifier.me" ] } client.run('SpacecraftMassRollup', config='spacecraft mass analysis', data=json.dumps(parameters)) {'state': 'INITIALIZING', 'simulationId': 'fc5fa7eb-761a-4d31-9201-2f51f1754675', 'project': 'SpacecraftMassRollup', 'elapsedTime': 187}
Get the simulation results.
Code Block title Request example for getting simulation results client.get_result('fc5fa7eb-761a-4d31-9201-2f51f1754675') {'outputs': {'me': 104.0, 'telecom.me': 34.0, 'telecom.amplifier.me': 15.0, 'telecom.antenna.me': 19.0, 'propulsion.me': 70.0, 'propulsion.tank.me': 38.0 'propulsion.thruster.me': 32.0}, 'verification': [{'property': 'propulsion.thruster.me', 'status': 'fail', 'value': 32.0, 'requirements': [{'id': '1', 'text': 'Estimated mass shall be less than allocated mass', 'status': 'fail', 'timestamp': 0}], 'constraints': [{'constraint': 'me < ma', 'status': 'fail', 'timestamp': 0}]}, {'property': 'telecom.amplifier.me', 'status': 'fail', 'value': 15.0, 'requirements': [{'id': '1', 'text': 'Estimated mass shall be less than allocated mass', 'status': 'fail', 'timestamp': 0}], 'constraints': [{'constraint': 'me < ma', 'status': 'fail', 'timestamp': 0}]}]}
Car Braking Analysis sample
The Car Braking Analysis sample project demonstrates the server-side simulation that calculates the stopping distance. You can use this project for the following scenarios:
- Running the project to see the relationship between the vehicle mass and braking distance.
- Running the project to calculate the stopping distance according to the car mass and speed.
| Note | ||
|---|---|---|
| ||
| Add the Car Braking Analysis sample project to the Teamwork Cloud server. |
To run the Car Braking Analysis sample to see the relationship between the vehicle mass and braking distance
Run the Car Braking Analysis project while changing the mass of the car, e.g., by 20 kg.
Code Block title Request example for running the simulation with a changed mass mass = [0] * 10 distance = [0] * 10 for x in range(0, 5): mass[x] = 800 + 20 * x parameters = { "inputs": { "grossMass": mass[x] } } results = client.simulate('CarBrakingAnalysis_final', config='Vehicle Analysis no Matlab', commit_results=False, data=json.dumps(parameters)) distance[x] = results['outputs']['stoppingDistance'] print(mass[x], distance[x] )Draw the chart of the relationship between the vehicle mass and braking distance.
Code Block title Request example for drawing the chart import numpty as np import matplotlib.pyplot as plt from matplotlib.pyplot import figure from io import StringIO figure(figsize=(16, 8), dpi=80) plt.xlabel('mass (kg)') plt.ylabel('stopping distance (m)') plt.title('The relationship between vehicle mass and braking distance', fontweight="bold", fontsize=20) plt.plot(mass, distance) plt.grid() plt.show()
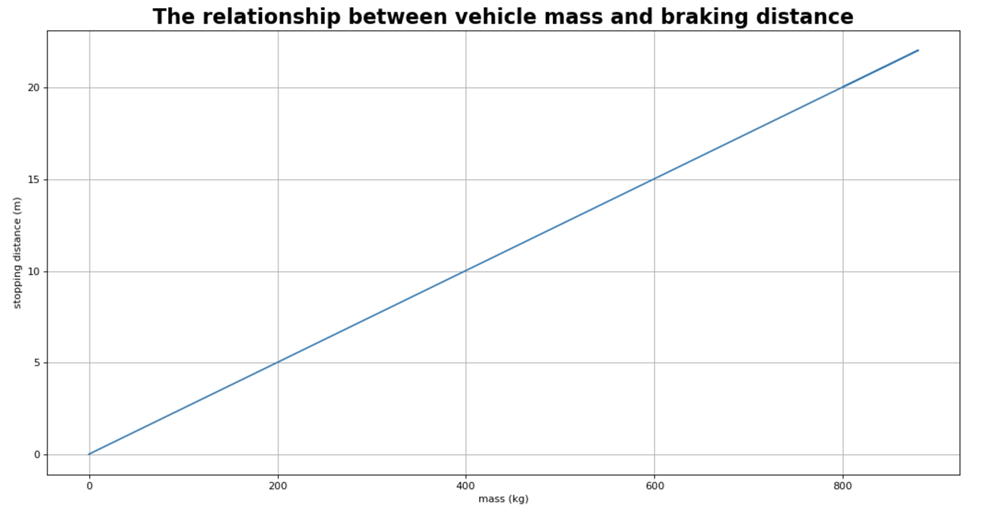
The chart showing the relationship between the vehicle mass and stopping distance.
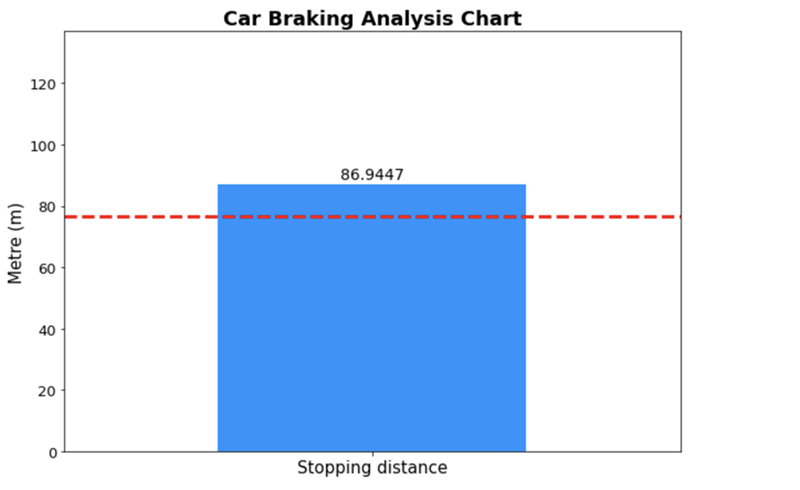
To run the Car Braking Analysis sample to calculate the stopping distance
Run the Car Braking Analysis sample to calculate the stopping distance according to the specified car mass and speed.
Code Block title Request example for running the simulation to calculate the stopping distance speed = input("Enter the car speed (km/h):") totalMass = input("Enter the car mass (kg):") parameters = { "inputs": { "grossMass": totalMass, "speed": speed } } results = client.simulate('CarBakingAnalysis', config='Vehicle Analysis no Matlab', data=json.dumps(parameters)) distance = results['outputs']["stoppingDistance"] requiredDistance = results['outputs']["requiredStoppingDistance"] print("Stopping distance:", distance) print("Failed requirements:") print(json.dumps(results['verification'], indent=2))Draw a chart to show the car stopping distance with the threshold of the required maximum stopping distance.
Code Block title Request example for drawing the chart import matplotlib.pyplot as plt import matplotlib as mpl import numpy as np import pandas as pd data = pd.DataFrame( {"distance": [distance]}) ax = data.plot(kind='bar' figsize=(10,7), color=['dodgerblue'], fontsize=13); plt.axhline(y=requiredDistance, linewidth=3, linestyle='--', color='r') ax.set_ylim([0, distance+50]) plt.title("car Braking Analysis Chart", fontsize=18, weight="bold") plt.ylabel("Metre (m)", fontsize=15) plt.text(0, distance+2, round(distance, 4), ha = 'center', fontsize=14) ax.get_legend().remove() plt.xticks(np.arange(1), ["Stopping distance"], rotation="horizontal", fontsize=15);