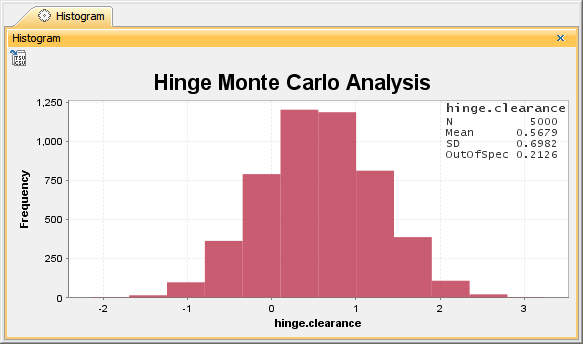
Cameo Simulation Toolkit introduces built-in support for Monte Carlo analysis, allowing you to manage uncertainties and estimate how random variation of sensitive parameters affects the overall performance of the system being modeled. A Histogram shows the density of the underlying distribution of data and estimates the probability density function of underlying variables. The total area of the Histogram used for probability density is always normalized to 1. A Histogram also allows you to dynamically view updates on those statistical values during the simulation. In addition, you can customize the properties, including title, plot color, and labels. For more information about using the Histogram in your model, see the built-in HingeMonteCarloAnalysis.mdzip sample as a demonstration.
A Histogram with dynamic statistical results (N, Mean, SD, and OutOfSpec).
Properties of the Histogram
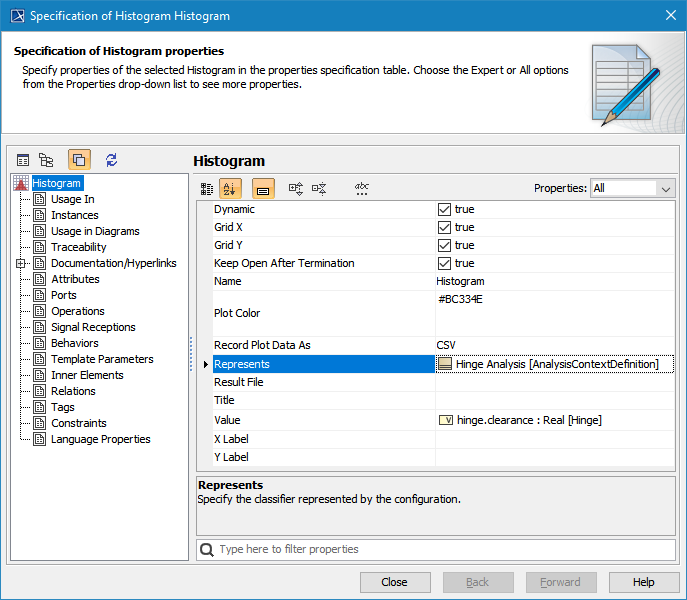
The Specification dialog of the Histogram contains the properties you can select and modify to change the display of the Histogram, as shown below.
The properties of the Histogram in its Specification dialog.
The following table describes the function of each property in the Specification dialog of the Histogram
Property
Function
Dynamic
If true, opening the Histogram during multiple executions shows dynamic results. Otherwise, the Histogram will be open when all executions are completed.
Note
title
Note
When the Dynamic property is set to true, the animation of the Histogram with dynamic statistical results (N, Mean, SD, and OutOfSpec) is available.
Grid X
To show or hide a vertical grid line.
Grid Y
To show or hide a horizontal grid line.
Status
colour
Green
title
Available from 19.0 SP1
Keep Open After Termination
To keep the Histogram open after the termination of the simulation.
Plot Color
To specify a plot color.
Record Plot Data As
To specify the selected format of the file to be saved if Result File is specified.
Result File
To specify the file name to be saved from the results in the selected file format specified in the Record Plot Data As property. Otherwise, the results will be saved into model elements.
Title
To specify the title of the Histogram.
X Label
To specify the label of the x-axis of the Histogram.
Y Label
To specify the label of the y-axis of the Histogram.
Note
title
Note
The Histogram can be used only as a local user interface, and the Number Of Runs «SimulationConfig» must be more than 1.
Using the Histogram
To use the Histogram
Create a Histogram element to a Represents Classifier, e.g., Hinge Analysis.
In the Specification window, specify the Value tag definition and properties whose values will be monitored in the Histogram. These properties must be the members of the Classifier represented by the Histogram element, e.g., hinge.clearance.
Set other properties as necessary, as shown in the property table, e.g., Name, Title, and Dynamic.
Drag the Histogram to the Monte Carlo Analysis «SimulationConfig».
Verify that UI = Histogram is shown in the «SimulationConfig».
Run the Monte Carlo Analysis «SimulationConfig».
Tip
title
Tips
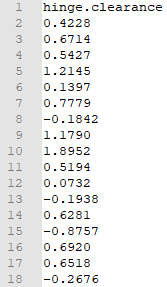
You can export the Histogram data as a CSV file by clicking the icon at the top-left of the Histogram pane. The Histogram is exported as a CSV file, shown below.