Space Tools
| Name | Size | Creator | Creation Date | Last Modification Date | Labels | Attached To |
|---|---|---|---|---|---|---|
| 110205_3.jpg | 28 kB | user-1438d | Jun 08, 2017 03:19 | Jun 08, 2017 03:19 | Exporting plots data to an instance model | |
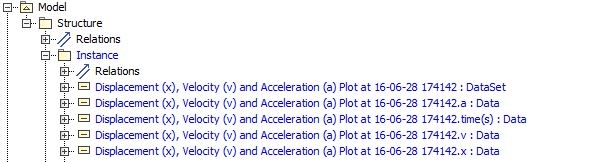
| plots_in_InstanceModel.png | 61 kB | user-1438d | Jun 08, 2017 03:19 | Jun 08, 2017 03:19 | Exporting plots data | |
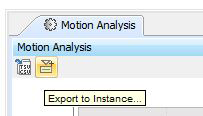
| Chart_toolbar2.png | 18 kB | user-1438d | Jun 08, 2017 03:19 | Jun 08, 2017 03:19 | Exporting plots data | |
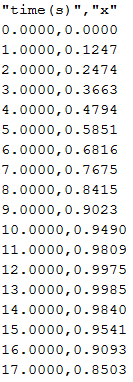
| dataplots_inCSV.png | 7 kB | user-1438d | Jun 08, 2017 03:19 | Jun 08, 2017 03:19 | Exporting plots data | |
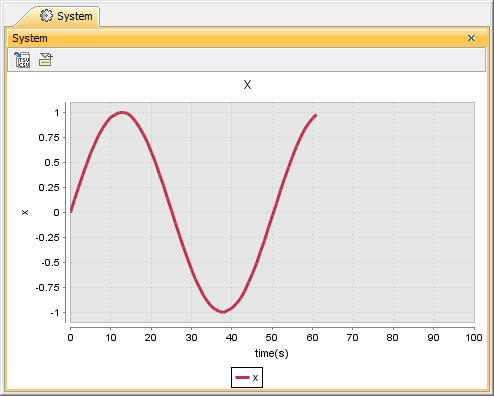
| plotted_timeserieschart.png | 16 kB | user-1438d | Jun 08, 2017 03:19 | Jun 08, 2017 03:19 | Exporting plots data | |
| Chart_toolbar1.png | 18 kB | user-1438d | Jun 08, 2017 03:19 | Jun 08, 2017 03:19 | Exporting plots data | |
| Time Series Chart with fixedTimeLocation undefined… | 35 kB | user-1438d | Jun 08, 2017 03:19 | Jun 08, 2017 03:19 | Specifying time axis' range in a Time series chart | |
| Time Series Chart with fixedTimeLocation 50.png | 17 kB | user-1438d | Jun 08, 2017 03:19 | Jun 08, 2017 03:19 | Specifying time axis' range in a Time series chart | |
| Time Series Chart with fixedTimeLength value 100.p… | 17 kB | user-1438d | Jun 08, 2017 03:19 | Jun 08, 2017 03:19 | Specifying time axis' range in a Time series chart | |
| 1.png | 39 kB | user-1438d | Jun 08, 2017 03:19 | Jun 08, 2017 03:19 | Specifying time axis' range in a Time series chart | |
| 2.png | 69 kB | user-1438d | Jun 08, 2017 03:19 | Jun 08, 2017 03:19 | Specifying time axis' range in a Time series chart | |
| TimeSeriesChart_3.png | 33 kB | user-1438d | Jun 08, 2017 03:19 | Jun 08, 2017 03:19 | Time Series Chart | |
| TimeSeriesChart_2.png | 66 kB | user-1438d | Jun 08, 2017 03:19 | Jun 08, 2017 03:19 | Time Series Chart | |
| Time_series_chart_specification.png | 48 kB | user-1438d | Jun 08, 2017 03:19 | Jun 08, 2017 03:19 | Time Series Chart | |
| specification-of-time-series-chart.png | 80 kB | user-1438d | Jun 08, 2017 03:19 | Jun 08, 2017 03:19 | Time Series Chart | |
| plot-result-location-property.png | 69 kB | user-1438d | Jun 08, 2017 03:19 | Jun 08, 2017 03:19 | Time Series Chart | |
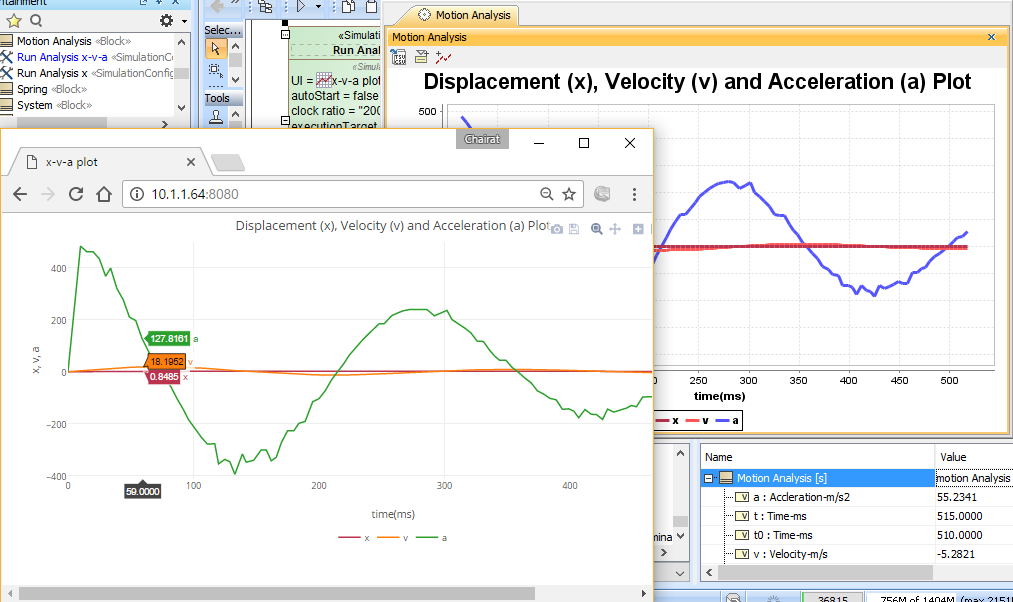
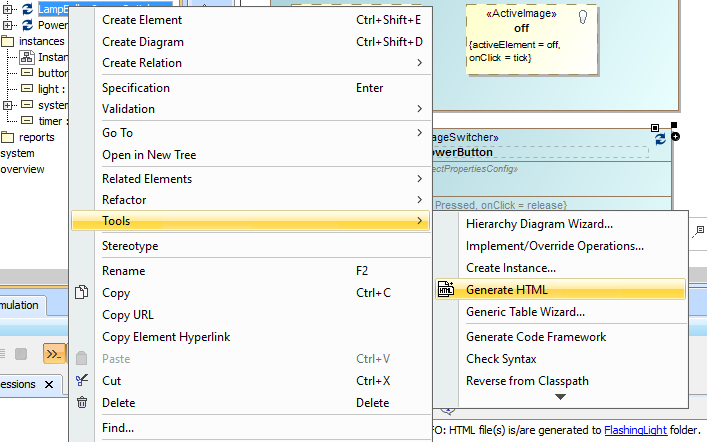
| 1.png | 42 kB | user-1438d | Jun 08, 2017 03:19 | Jun 08, 2017 03:19 | Image switching in web user interface | |
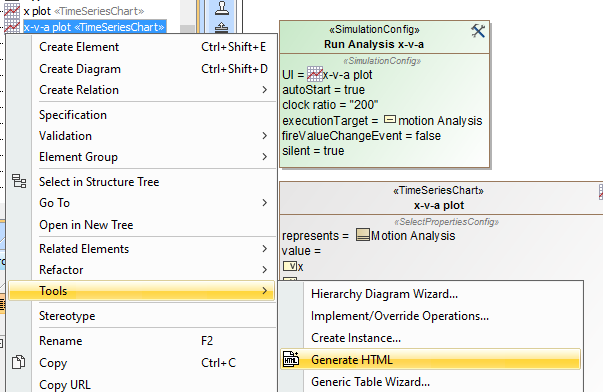
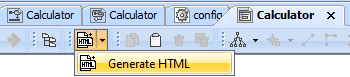
| generateHTML.PNG | 8 kB | user-1438d | Jun 08, 2017 03:19 | Jun 08, 2017 03:19 | Image switching in web user interface | |
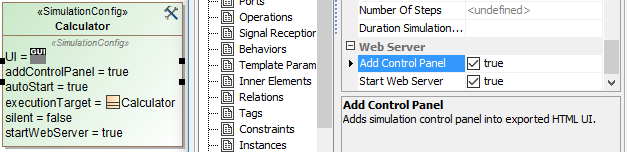
| AddControlPanel.png | 37 kB | user-1438d | Jun 08, 2017 03:19 | Jun 08, 2017 03:19 | Control panel for Web UI | |
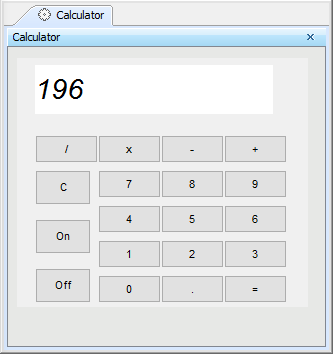
| calculatorUI_normal.png | 7 kB | user-1438d | Jun 08, 2017 03:19 | Jun 08, 2017 03:19 | Control panel for Web UI |