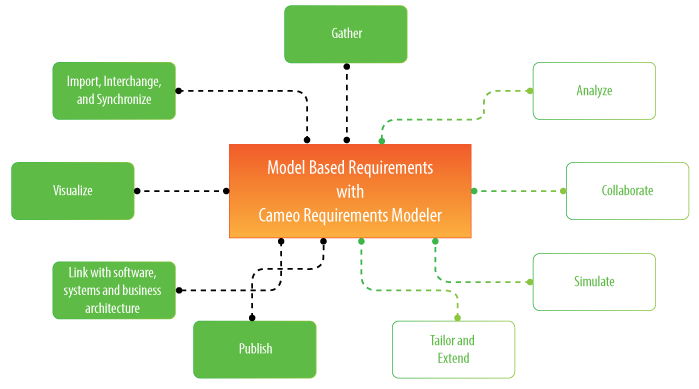
Model-based requirements engineering brings the value of:
- Easy identification of the scope and potential consequence of any change.
- Single and consistent data source: requirements, processes, and design.
- Increased quality of requirements due to the automatic validation and better visibility.
- Saved time and resources as you are working in the same environment where your models are.
- Improved team communication with a simple and standard notation, clear diagrams, and a web-based report.
With this plugin you can:
- Import requirements in a ReqIF file from other requirements management tools, such as IBM DOORS 9.4 and 9.5, IBM DOORS Next Generation, PTC Integrity, Polarion, and Siemens Teamcenter.
- Trace from requirements to other model elements of business, software, or systems architecture and align requirements with your model.
- Analyze the impact of a change.
- Track metrics.
- Capture requirements in dedicated diagrams, matrixes, and tables.
- Document requirements.
- Extend the plugin by creating new requirement types and customizing the plugin’s functionality.
For more information, visit the Cameo Requirements Modeler Plugin page.
Glossary saves time by ensuring consistent usage of terminology in the organization. It also improves the communication between team members since terms are understood in the same way and definitions become visible everywhere the terms are used.
Creating a term is quick and easy. Just do one of the following:
- Add any word or phrase to the glossary while typing or editing.
- Drag any element you wish to become a term to the glossary table.
- Click the Add New or Add Existing button on the glossary table toolbar.
After terms are defined in the glossary, it is easy to use them in your project. Just press Ctrl+spacebar while typing to get a list of available terms.
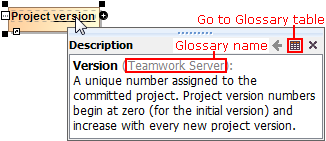
For your convenience, a term description becomes visible when you move the pointer over this term.
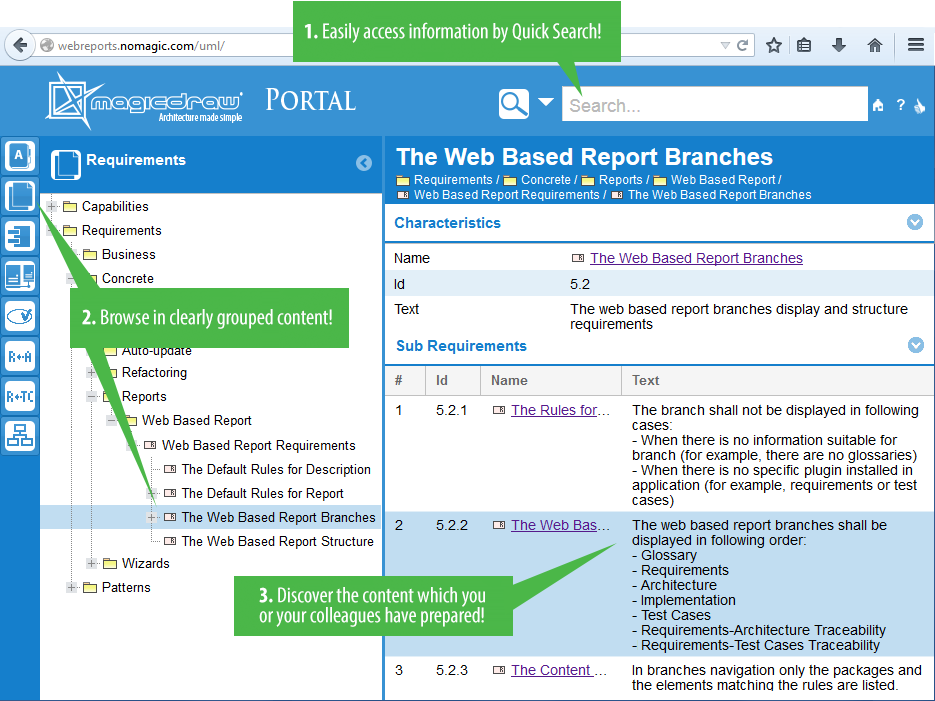
Publish your project as interactive web portal and share it with stakeholders, including even those who are incapable of reading models in MagicDraw!
The published web portal eliminates less needed elements from the model tree and proposes the most relevant views of software engineering project, such as Glossary, Requirements, Architecture, and Implementation. So you can discover your project in user-friendly and easily browsable environment.
Use quick search to find elements and diagrams for viewing their custom contents and share this information with colleagues. Provide feedback on any element or diagram.
Publishing the project as a web portal is as easy as generating any report. On the main menu, click Tools > Report Wizard, select the Software Engineering Portal template, and follow the steps of the report wizard. Then place the output in a shared directory or on web server to make it available for colleagues.
IMPORTANT! The Software Engineering Portal template is only available in MagicDraw Enterprise edition. In other editions, MagicDraw provides a demo version of this web report template, which can contain, at most, 10 symbols per view.
NOTE. This is a technology preview of the software engineering portal. Please explore this new portal, experiment with it, and get back to us at support@nomagic.com with your feedback and suggestions about possible improvements or features you are missing. We seek to create as serviceable tool as it could be, so we are thankful and very appreciative of your contributions!
With this new approach you can
- Create metric suites for calculating metrics.
- Calculate metrics according to given parameters.
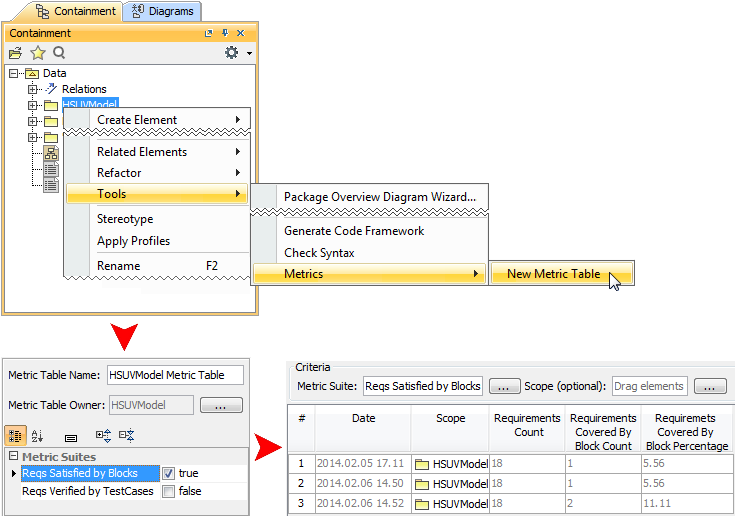
- Easily customize the representation of the metrics in the new type table – the metric table.
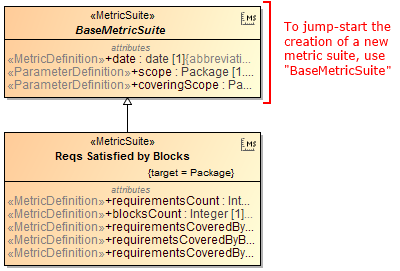
Creating a new elementary metric suite is as simple as creating a new class with a couple of stereotyped attributes: one for parameter definition and one for metric definition.
The parameter definition can be any model element or a primitive type, such as real or integer. The metric definition, that is, a formula for calculating metrics, can be easily specified either as a structured expression (by using the operations of the expression evaluation engine) or as a script operation written in any script language supported by MagicDraw (for example, JavaScript, Jython, Groovy). Moreover, one metric definition can use the results of other metric definitions.
Once the metric suite is created, you can calculate the metrics for a selected element. Analyze the results of the calculations, that is, metrics, in a metric table, which is automatically created for these metrics representation. You can easily reorganize the columns of the table, calculate new metrics, and recalculate the existing metrics with other parameters.
The recent enhancements for modeling efficiency saves time, which allows focusing on what to model, but not how to model and keep the result well-formed:
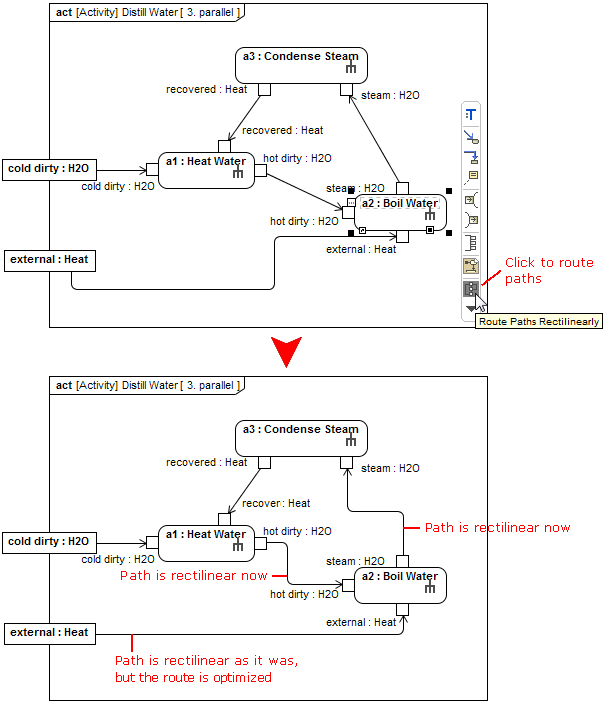
- Drawing paths does not require manual support for the path layout optimization. The path automatically chooses the optimal route. Learn more
- Browsing diagrams in the same tab reduces the number of open unneeded diagrams and enables effective navigation through different aspects of the model side-by-side. Learn more
- Creating a new diagram is no longer a challenge with the new Create Diagram dialog designed to minimize the time spent looking for the proper menu command or toolbar button, especially if you have plugins installed. Learn more
- Simplified and unified UI for symbol manipulation makes the symbol customization easier and intuitive. Learn more
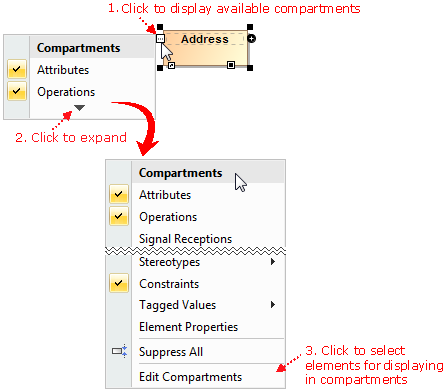
- Slight changes in compartments behavior make your work with diagrams easier and simpler. Learn more
- Scope selection enables automatic update of tables. Learn more
Smarter path layout
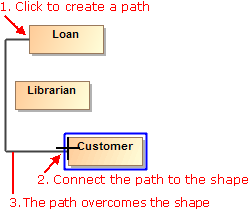
Now you can get professional-looking diagrams quickly, without the need to adjust the path layout manually. When drawing new paths, reconnecting or moving paths, or resizing connected shapes, the automatic layout does most of the work in optimizing the routes for these paths, so you can focus on model creation.
Here are the rules of the new path behavior:
- The path always chooses the optimal route.
- When reconnecting the path end to a nearby shape, the existing breakpoints of the path persist. However, if the path route changes a lot, the path is re-laid out.
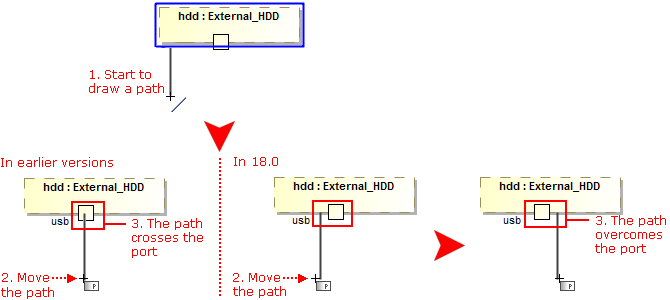
- When drawing a new path or reconnecting path ends, the path overcomes obstacles.
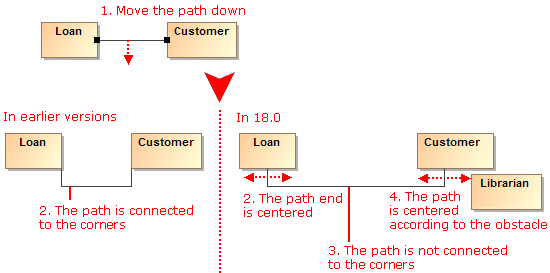
- If there are obstacles on the shape border (for example, Ports, Pins, paths), the path end is centered according these obstacles.
- If there are obstacles on the shape border (for example, Ports, Pins, paths), new paths overcome these obstacles.
- Path ends avoid connecting to the shape corners. Moreover, the path ends are centered considering the obstacles on the shape border or nearby shapes.
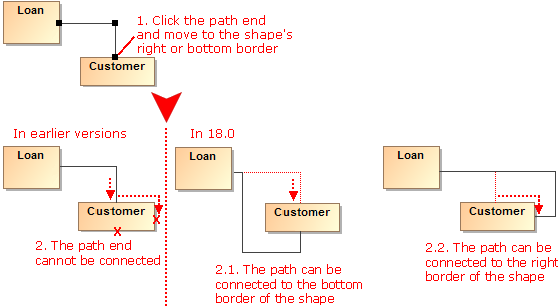
- The path end can be connected to the right or bottom border of the shape.
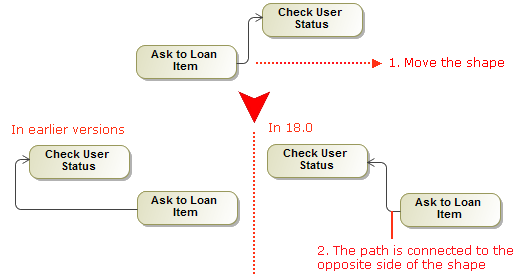
- After switching positions of shapes, path ends become glued to the closest borders.
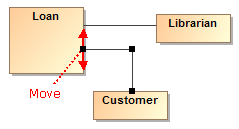
- The path end can be moved up and down or to the left or right on the shape border.
Also, now you can make the route of a single path or the routes of all the paths connected to a selected shape rectilinear with just one click.
Tabbed browsing between diagrams
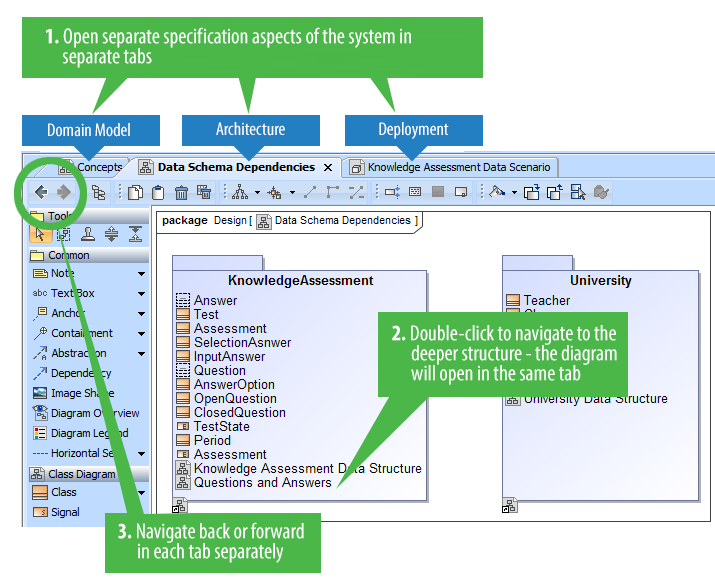
Got lost between open diagrams? In earlier versions, every diagram could open only in a new tab. Now you can choose to open diagrams either in the same tab or in a new tab – just like in the most popular Internet browsers.
Here are the benefits of using the tabbed browsing:
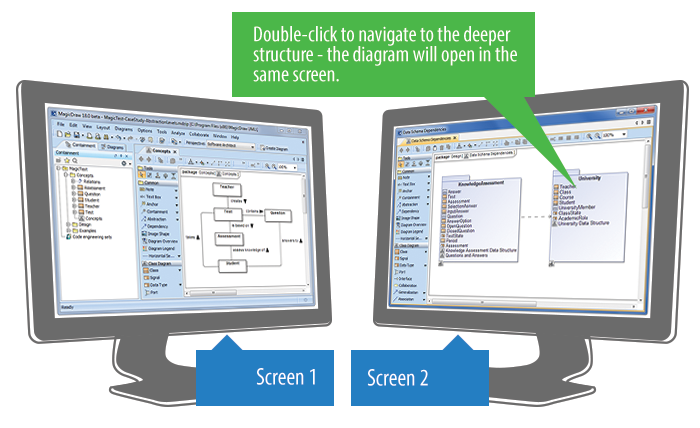
Different aspects of the system (for example, requirements, architecture, test cases, domain models) can now be analyzed in separate tabs. Both backward and forward navigations are supported for each aspect (tab) separately. Navigation does not open new tabs by default, which greatly helps in limiting the number of open tabs.
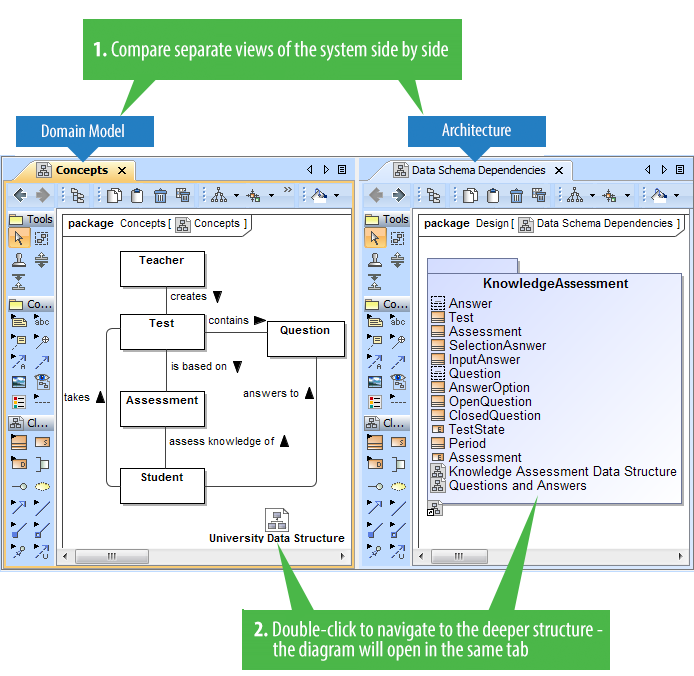
- Ability to compare separate views of the system side-by-side. For example, business and IT architectures can now be displayed in two tabs side-by-side and analyzed by drilling down in their hierarchies. Navigation deeper in the structures will not open new tabs, which allows the smooth analysis of the modeled system.
- Smooth work with multiple screens. Browsing in a tab of the second screen never opens diagrams in the first screen, which means you stay in the same screen. New tabs open in the same screen, to the right of the active one.
New Create Diagram dialog
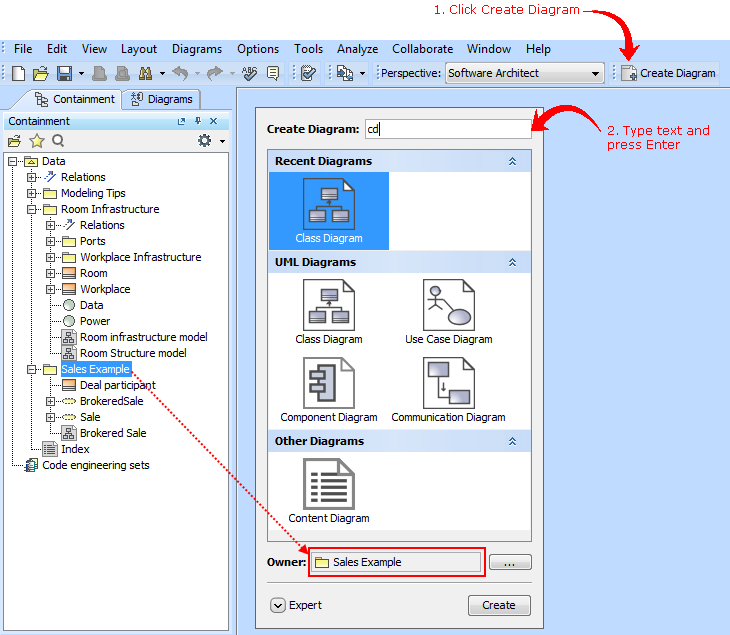
Spending too much time searching for the specific diagram to create? Now you can create any diagram you want in just a few seconds despite the number of diagrams! Simply click the Create Diagram button (or press Ctrl+N), type the first letters or a part of the diagram type name, and press Enter.
The enhanced Camel Case mode in Search engine makes the diagram creation even faster, as it allows:
- Search using non-capital letters – "ucd" instead of "UCD".
- Skip the spacers – "cv3" works as well as "CV-3" or "cv-3".
- Perform partial search – "ibd" finds SysML Internal Block diagram.
Unified manipulation of symbols
Simplified and unified UI for symbols manipulation makes the symbols customization easier and intuitive:
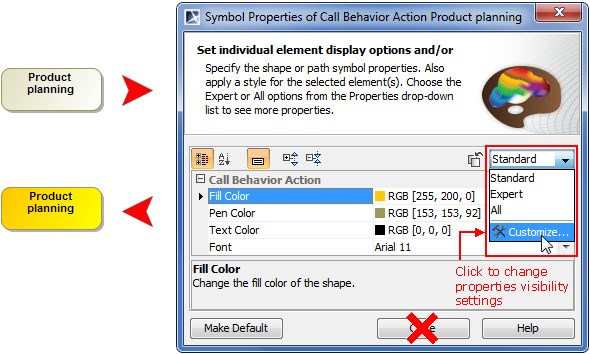
Now you can see how your shapes or paths changes immediately after modifying their symbol properties without closing the Symbol Properties dialog. Also, while the dialog is open you can still work with diagrams or other dialogs. The ability to group the properties by display modes (Standard, Expert, All) allows the hiding of unnecessary properties, thus making the dialog simpler and faster to use.
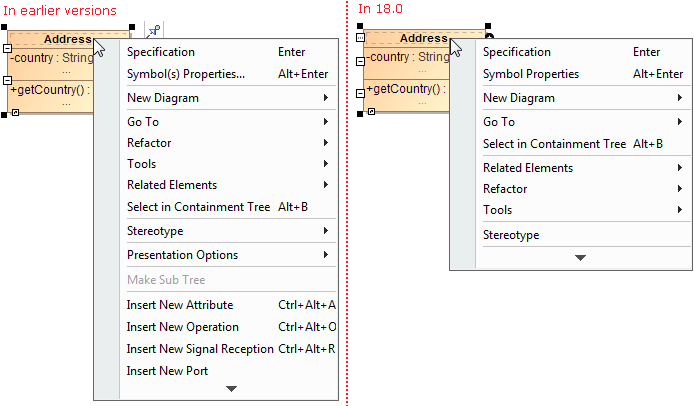
- Lists of properties in the Symbol Properties dialog and on the symbol's shortcut menu are re-arranged and much shorter now. Furthermore, you can customize these lists according to your needs.
- New smart manipulators enable the faster creation of new elements in compartments as well as easier management of these compartments.
Extended Script Languages Support
| Custom validation rules, derived properties, queries for smart packages, metric definitions, criteria for dependency matrices, and so forth can now be defined in any of the following languages: JavaScript, Jython, JRuby, Groovy, and BeanShell. Learn more |
Instance Tables
| Need to handle a huge amount of instance specifications? Feel annoyed about editing their slot values one by one in the limited-size cells of the Specification window? Try instance tables! Learn more |
UML 2.5 Support
| As a honored member of OMG, we are proud to state that MagicDraw is a pioneer in support of the latest major UML standard. Learn more |
Other News
Document Modeling Plugin (Technology Preview)
Command Line Utility for Teamwork Server Administration
Discontinued Compatibilities and Dropped Integrations – Important for OS X users
Miscellaneous
File Format Changes
Open API Changes
