Generating an HTML table from a UI table, Time series chart, and CSV export configuration
On this page
Generating an HTML table from a UI table
This feature of the Magic Model Analyst / Cameo Simulation Toolkit enables you to export MagicDraw HTML tables in UI modeling diagrams to HTML5, allowing them to be viewed in a embedded web browser. The sample model used on this page, SpacecraftMassRollup.mdzip, demonstrates how to create a User Interface table in the User Interface Modeling diagram, generate HTML, run the simulation, and view the UI table in HTML5 in your embedded browser.
To generate an HTML table from a UI table component
- Open the <modeling_tool_install_dir>\samples\simulation\SpacecraftMassRollup.mdzip file.
Right-click the Model element in the containment tree and select Expert in the Contextual Menu.
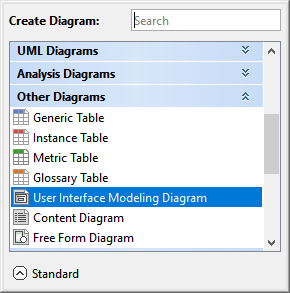
Select Create Diagram > Other Diagrams > User Interface Modeling Diagram.
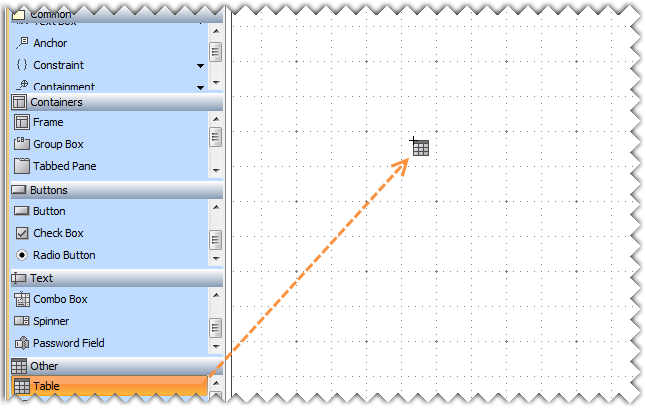
Drag a UI table component onto the newly created diagram.
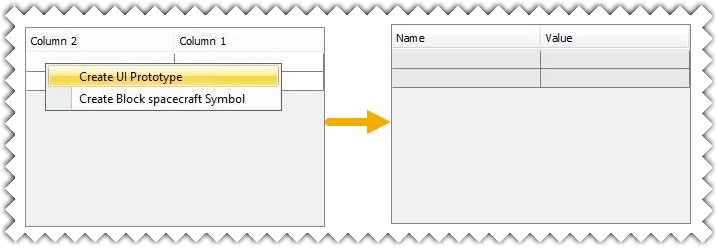
From the Containment tree, drag the spacecraft Block present in the Structure Package to the table and using a long drop select Create UI Prototype. The table headers will change from Column 1 and Column 2 to Name and Value.

Tip
If you drag the spacecraft Block to the table quickly, the column name will change automatically, without having to select Create UI Prototype.
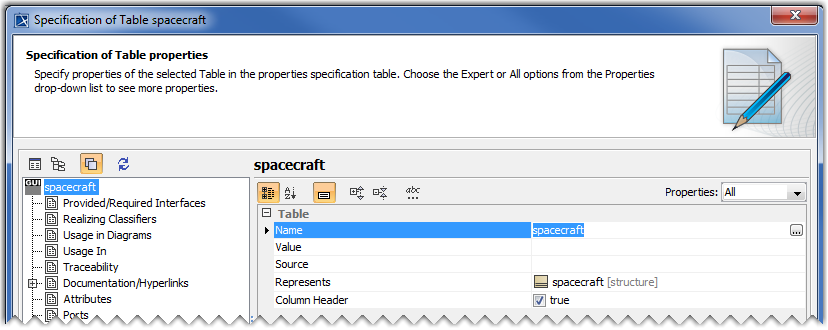
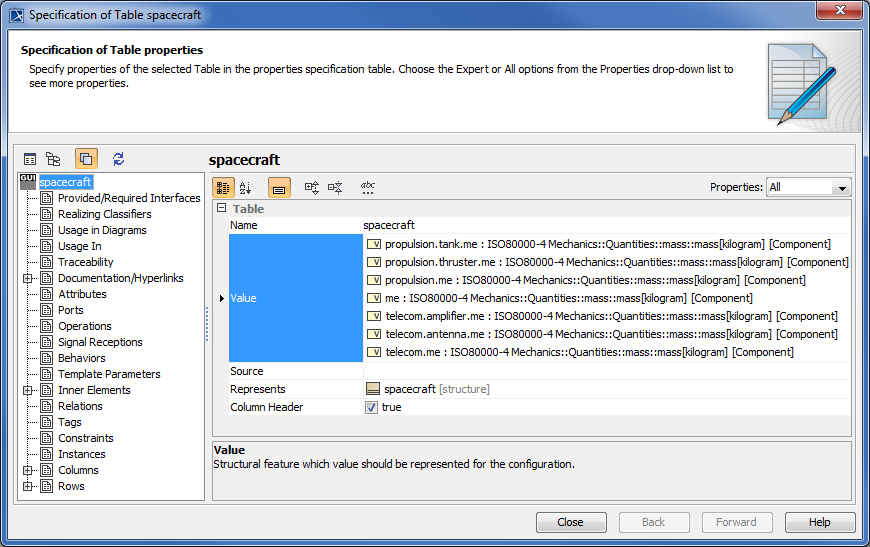
Open the Specification dialog of the UI Table and verify that the Classifier is assigned to the Represents property.
Click
 beside the Value property and select the values you want to monitor from the tree view in the Select Nested Properties dialog and Click OK.
The selected values will appear in the Value property in the UI table Specification window.
Specify the created Table UI as UI of the Simulation Configuration.
Set the Show UI As HTML property to true.
Run the spacecraft mass analysis with Table Simulation Configuration. The HTML table will be opened in an embedded browser.
You can edit the Documentation/Comments tag from the UI table's Specification window and run the simulation again, it will show the table's descriptions. To learn more refer to the Comment page.
Generating an HTML table from a Time series chart and CSV export configuration
An HTML table can also be generated from a Time series chart and CSV export configuration.
To generate an HTML table from either a Time series chart or a CSV export configuration
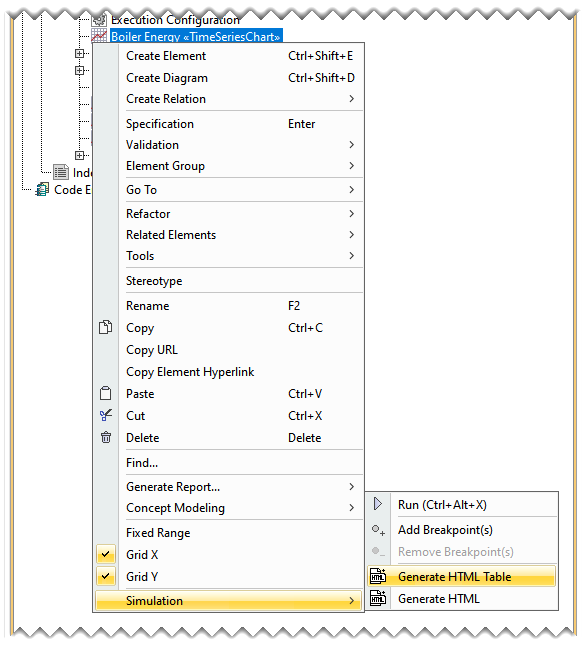
Right-click a Time Series Chart or a CSV Export configuration and choose Simulation> Generate HTML Table.
- This will generate an HTML file, which can be viewed either online or offline. A message stating that the HTML table is generated will be displayed in the Simulation Console pane.
Sample model
The model used in the figures on this page is the SpacecraftMassRollup.mdzip sample model that comes with your modeling tool.
To open the sample
- Find it in the modeling tool <modeling_tool_install_dir>\samples\simulation\SpacecraftMassRollup.mdzip.