The Variables panel allows you to visualize variable values over time using a Time Series Chart. The chart displays time-series data for numerical variables during the simulation.
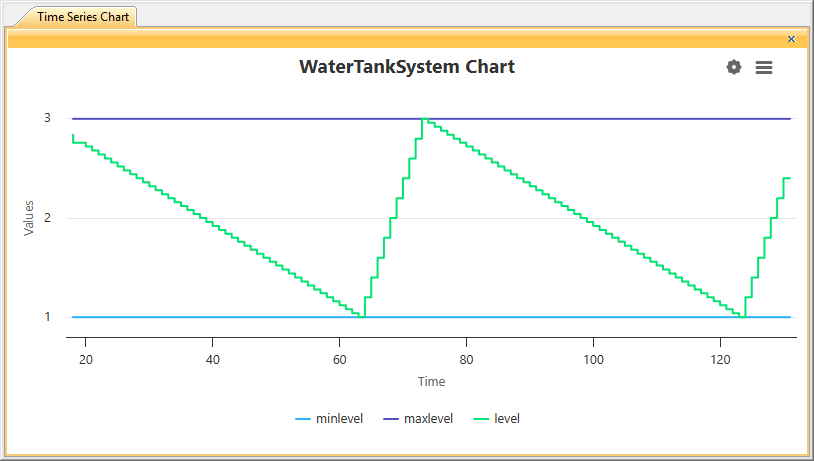
Time Series Chart
Opening Time Series Chart
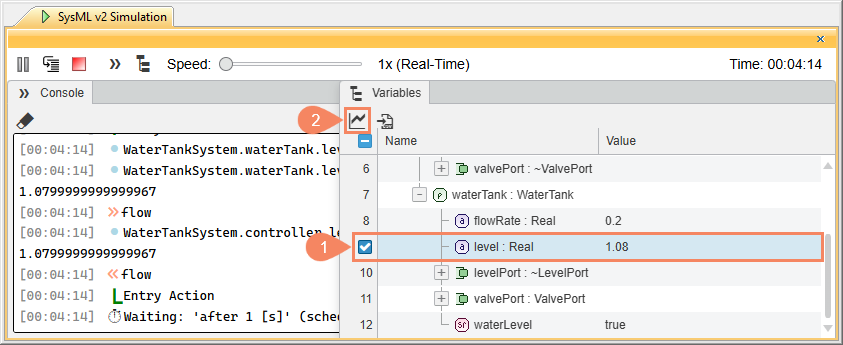
To open a Time Series Chart
- In the Variables panel, select the check boxes for one or more numerical attributes or references.
- In the panel toolbar, click
 .
.
The chart window opens and displays attribute values starting from the moment it is opened. You can open multiple Time Series Charts simultaneously.
Adding variables to an open chart
To add additional variables to an existing chart:
- Select one or more numerical attributes or references using checkboxes or directly from the variable tree.
- Right-click the selected variables.
- Select Insert to Chart.
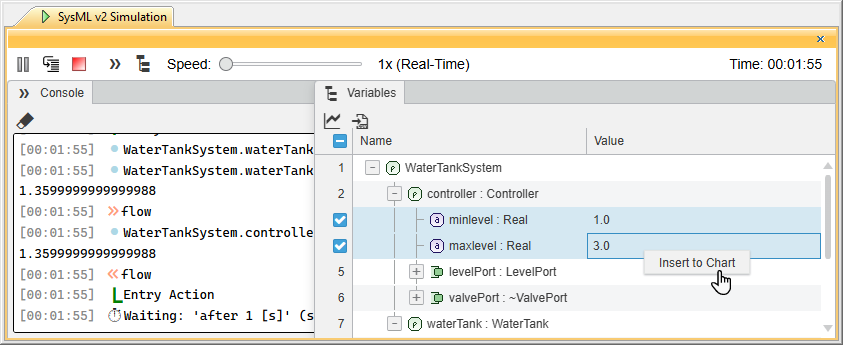
The selected variable is added to the chart visualization.
Chart display options
You can choose from several visualization options in an open Time Series Chart for better readability and easier analysis of the chart.
To configure Time Series Chart display options
- In an open Time Series Chart, click
 and select one or several of the following options:
- Interpolation (Linear) - to display the chart as either a curvilinear or linear line.
- Show Data Points - to show or hide data points on the chart lines.
- Show Values - to show or hide numeric values in the chart.
Exporting chart data
You can export the data of an open Time Series Chart to multiple formats for external use. Available export formats are: PNG, JPEG, SVG, CSV, and XLS.
Exported chart data can be useful for data analysis, reports, or documetnation.
To export Time Series Chart data
- In an open Time Series Chart, click
 and select one of the following options:
- Download PNG image
- Download JPEG image
- Download SVG vector image
- Download CSV
- Download XLS
- In an open window, select the directory where you want to save the file.
- Optionally, change the file name.
- Click the Save button.
The file is downloaded to your selected location.