On this page
In Cameo Simulation Toolkit, a Time series chart displays plots of runtime values with respect to simulation time. You can show a Time series chart of any runtime values during model simulation. The Time series chart measures time on the X-axis (horizontal axis) and runtime values on the Y-axis (vertical axis). The graph of the time series chart simulates the movement of the values or data over time. It allows you to evaluate trend or monitor behavior in the selected values within a specific period of time. You can use a time series chart to display real-time plotting of runtime values on the Y-axis, along with simulation time on the X-axis (as in the simulation time and clock settings). You can also customize most of the chart properties according to your preferences, including title, plot color, min and max value, and external CSV. For further information, see the built-in sample MotionAnalysis.mdzip, used throughout this page to demonstrate how to use the Time series chart in your model.
Properties of Time series charts
The Specification window of a Time series chart contains the properties you can select or modify to change the display of the Time series chart. The following figure shows the Specification dialog of the Time Series chart:

The properties of Time series chart in its Specification window.
The following table describes the function of each property of the Specification dialog of Time Series chart:
| Property | Function |
|---|---|
| Load CSV File | A load CSV file is a file that the Time Series chart will load as a curved line graph. You can import multiple CSV files into the Time series chart and load them as curved line graphs. They will be represented with different colors and legend names (same as the filename extension) so you can compare the differences between the actual results and the desired line graphs. |
| Record Plot Data As | To specify the selected format of the file to be saved if Result File is specified. |
| Result File | To specify the file name to be saved from the results in the selected file format specified in the Record Plot Data As property. Otherwise, the results will be saved into model elements. |
| fixedTimeLength | To specify a fixed range of the time axis in a Time series chart. If you specify a value, the time axis range will be fixed to that particular value. If you do not specify the value of Fixed Time Location, the plot(s) will move to the left if the time range is greater than the maximum value of the time axis. A fixed time length unit is specified by a time unit tag definition of the simulation config. If you do not specify the time unit, Cameo Simulation Toolkit will use the millisecond as the default unit. |
| fixedTimeLocation | To specify the start time of the time axis in a Time series chart. If you specify a value for the Fixed Time Length but leave the Fixed Time Location value empty, the Time series chart will work like an oscilloscope. The plot(s) will move to the left. A fixed time location unit is specified by a time unit tag definition of the Simulation Config. If you do not specify the time unit, Cameo Simulation Toolkit will use the millisecond as the default unit. |
| Y Label | To specify the label of the y-axis of the Time series chart. |
| Title | To specify the title of a Time series chart. |
| Fixed Range | To specify whether a Time series chart will automatically adjust the range on the Y-axis. If the value is true, the range of the Y-axis will be fixed; otherwise, the range will automatically change. |
| Grid X | To show or hide a vertical grid line |
| Grid Y | To show or hide a horizontal grid line. |
| Max Value | To specify an upper bound value of the Y-axis. |
| Min Value | To specify a lower bound value of the Y-axis. |
| Plot Color | To specify a plot color. |
| Refresh Rate | To specify the time intervals at which the Time Series Chart should be refreshed. The unit of the refresh rate is the same as the Time Unit property value of the Simulation Configuration. If the time unit is not specified, the refresh rate is measured in milliseconds. If the refresh rate is not specified, the value of 1000 is used. Specify 0 to refresh the chart every time the value is changed. |
| Linear Interpolation | If true, a curvilinear graph will be displayed. If false, a linear graph will be displayed. |
The following figure shows the configuration settings of both Time series chart and Simulation Config of the MotionAnalysis.mdzip sample project. The Time series chart has been set as the "Represents" field to the Motion Analysis block together with the "Values" field to the required properties (x, v, and a), along with other properties as needed. Also, the Simulation Config "UI" field has been set to the Time Series Chart (x-v-a plot).
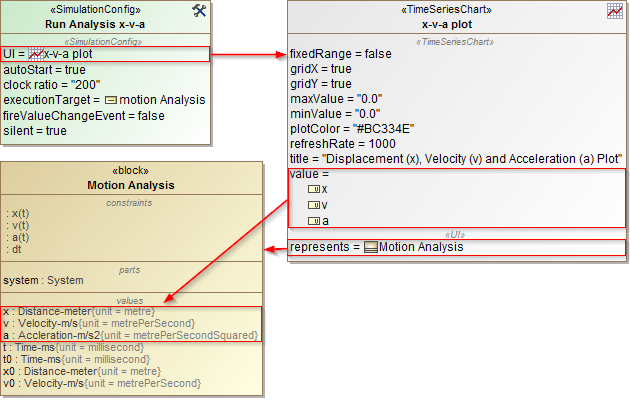
The configuration settings of both Time series chart and Simulation Config of the MotionAnalysis.mdzip sample project.
Once the simulation begins, the Time series chart displays real-time plotting of the x, v, and a properties with time(s), as shown in the MotionAnalysis.mdzip sample.
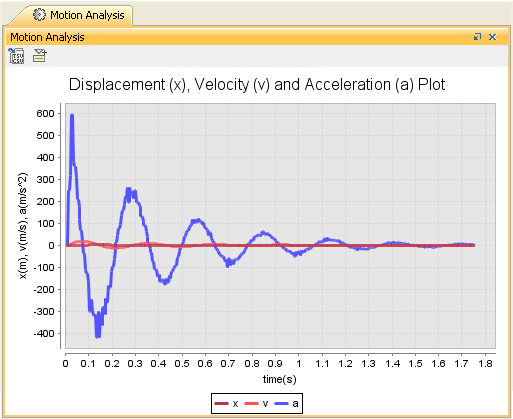
Real-time plotting of the x, v, and a property with time(s) in the MotionAnalysis.mdzip sample.
Using a Time series chart
To display a Time series chart
- Open the context menu of the Variables pane.
- Right-click the row of a runtime value, which must be shown on the Time series chart. Select Show in time series chart (see the Time series chart for more information).
The Cameo Simulation Toolkit's Time series chart can also serve as a predefined subtype of UI config. You can use it as a UI mockup of the SimulationConfig element just like an ImageSwitcher.
To use a Time series chart
- Create a TimeSeriesChart element to represent a Classifier.
In the Specification window, specify the value tag definition and properties whose values will be monitored in the Time series chart. These properties must be members of the Classifier represented by the Time series chart element.

Glossary
- CSV
A CSV is a comma-separated values file that stores tabular data (text and number) in plain text. Each line in the file is a record; each record consists of one or more fields, separated by commas.
- Runtime value
A runtime value refers to the value of the structural features contained in the created object during model simulation.
- Time series chart
A Time series chart is a graph that can simulate runtime values over a specific period of time.
Sample model
The model used in the figures on this page is the Motion Analysis sample model that comes with a modeling tool. To open this sample, do one of the following:
- Download MotionAnalysis.mdzip.
- Find in modeling tool <modeling tool installation directory>\samples.