Cameo Simulation Toolkit supports Functional Mockup Interface (FMI) Version 1.0 and 2.0. FMI 2.0 co-simulation applies when several FMIs are connected in Internal Block diagrams (IBD), an integration of separate independent black box simulation models along with the master algorithm.
FMI is a standard that supports model exchange and co-simulation of models. A component that implements FMI is called FMU (Functional Mockup Unit). Cameo Simulation Toolkit is also capable of reading FMU files. An FMU is a zipped file containing an XML description file and implementation in binary form that executes the equation representing the component’s Behavior.
Important
Before simulating FMU files, you must make sure the following conditions are met:
- The FMU files and the project must be in the same directory.
- The FMU files must be OS-platform supported, e.g., Win64, Win32, linux64, linux32, etc. (Cross-platform execution of FMU files is not supported.). You can see all supported platforms in the Binaries folders of the FMU files. If the platform you are using is not in the Binaries folder, it will not be supported.
To co-simulate FMU blocks
- Drag FMU files into a Block Definition diagram of the SysML project. The FMU files will be presented as «block» and «fmu» stereotypes along with ports. You may create associations (aggregations) with the main system block to make the FMU files become part properties.
- If there is only one FMU file to simulate, proceed to Step 3. Otherwise, you will have to create an Internal Block diagram for the main system block to automatically include part properties in the diagram. Select the Flow Port context menu to show flow ports of those properties and create connections as needed.

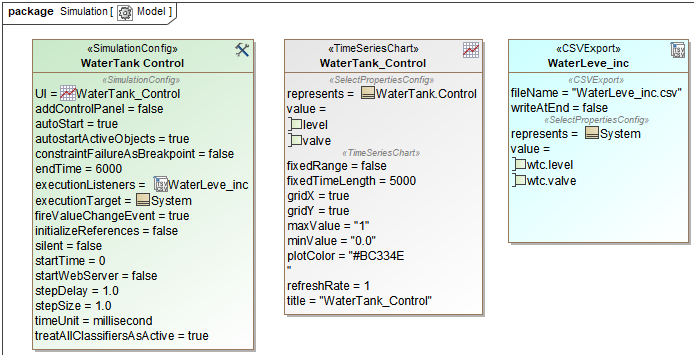
3. Create a Simulation Configuration diagram and specify start time, end time, and either step size or number of steps in the properties of the Simulation Configuration. Add a Time series chart and specify values of FMUs. You can include CSVExport to store the results.
4. Run the Simulation Configuration and see the results in the Time series chart and Variables pane, as well as the resulting Excel file from CSVExport.
