The Time series chart can read data from a CSV file and represent them in a curved line in the chart. The property External CSV in the Time series chart enables you to import an external CSV file and load data from the file.
The time Series Chart can read a CSV file with data in multiple columns and show them in lines in the chart. (The first column is always the value of time on the y-axis) and read multiple CSV files and show them all at once.
To show data from a CSV file in the Time series chart
- Click the Load Data... button on the toolbar of the Time series chart's plot pane.
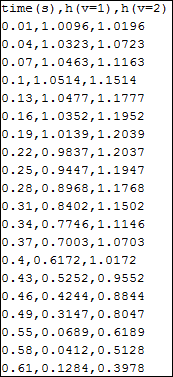
Select a CSV file (see an example of the result data in a CSV file), and the Time series chart will show data from the columns in the file in lines.
The following figure shows a line chart. The solid line in the chart represents the values plotted Cameo Simulation Toolkit while the dashed lines represent the values from the CSV file.
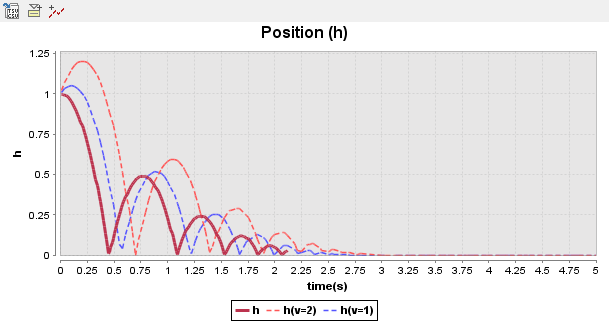
A line chart with the solid line representing the plotted values and dashed lines representing the values from the CSV file.
Related pages