You can specify the range of the time axis (horizontal axis) in a Time series chart by providing the values of fixedTimeLength and fixedTimeLocation. The fixedTimeLength and fixedTimeLocation units are specified by timeUnit when a model-based clock is used (For more information about model-based clock, see Model-based Clock). Otherwise, the unit for value is the millisecond.
You can use the fixedTimeLength property to specify the range of the time axis. If you do not define the value of fixedTimeLength, the time axis will expand as long as the maximum duration a simulation will run. The following figure shows a Time series chart when the fixedTimeLength value is 100 seconds
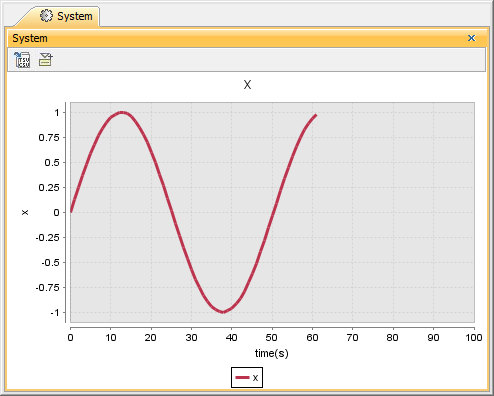
A Time series chart when the fixedTimeLength value is 100 seconds.
You can also change the minimum value of the time axis in a Time series chart by specifying the value for fixedTimeLocation. The following figure shows a Time series chart when the fixedTimeLength value is 100 seconds, and the fixedTimeLocation value is 50 seconds
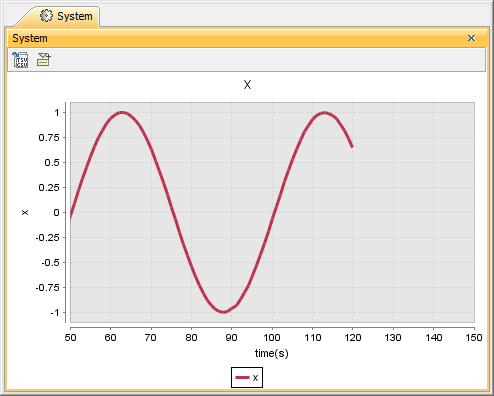
A Time series chart when the fixedTimeLength value is 100 seconds, and the fixedTimeLocation value is 50 seconds.
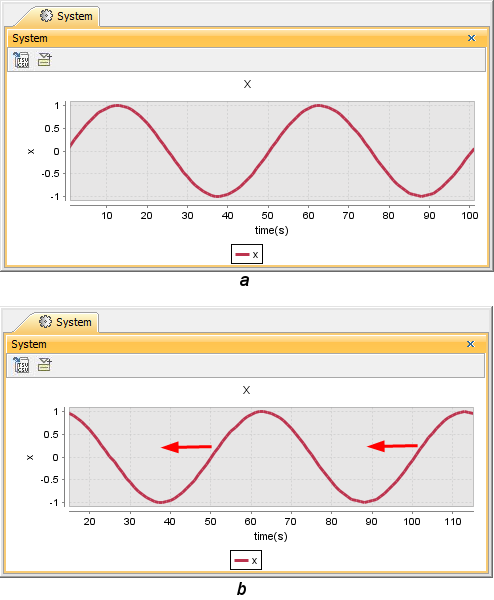
If the value you define only that of the fixedTimeLength value, the minimum value of the time axis will change automatically to adjust to the total length of time that you have defined as the value of fixedTimeLength. This situation will occur when the simulation time is greater than fixedTimeLength. If this happens, the maximum time axis value will be the actual simulation time and the minimum time axis value will increase to preserve the current value of fixedTimeLength.
If fixedTimeLength is 100 seconds, the range of the time axis will be [0, 100] (If you do not specify fixedTimeLocation, the minimum time axis value will be 0). However, if your simulation model runs longer than the simulation time or more than 100 seconds, e.g., 115 seconds, the range of the time axis will be [15, 115]. This particular Behavior of Cameo Simulation Toolkit's Time series chart is similar to that of Oscilloscope when fixedTimeLocation is unspecified.