Cameo Simulation Toolkit allows you to show the plot between runtime values, which are the numerical value and simulation time. This plot is called Time series chart. To view this chart during a model simulation, right-click the row of a runtime value in the Variables pane and select Show in time series chart.
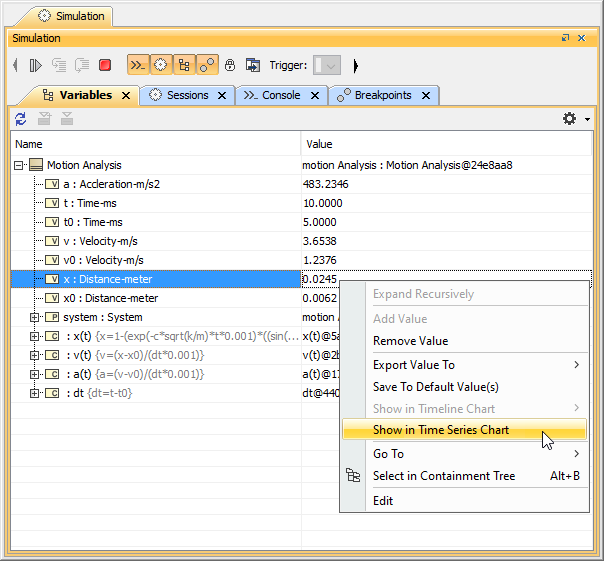
The context menu showing the runtime value in the Time series chart.
The Time series chart shows the runtime value with respect to simulation time shown as follows
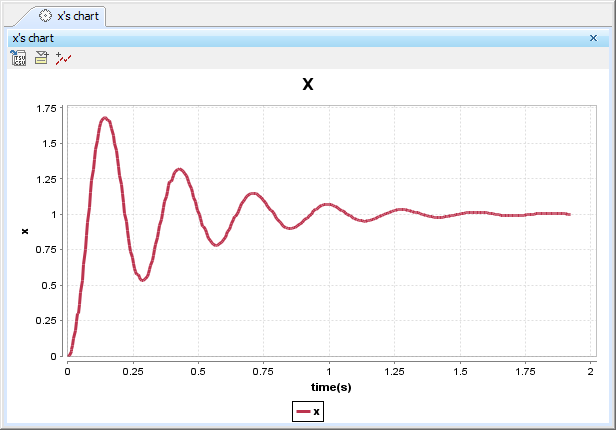
The Time series chart of runtime value of Property x.
Related page