On this page
Cameo Simulation Toolkit introduces built-in support for Monte Carlo analysis, a technique that involves using random numbers and probability to solve problems. You can manage uncertainties and estimate how random parameters affect the overall performance of the system being modeled. Please refer to the HingeMonteCarloAnalysis sample model on the welcome screen as the feature demonstration with the following steps.
Creating a system model
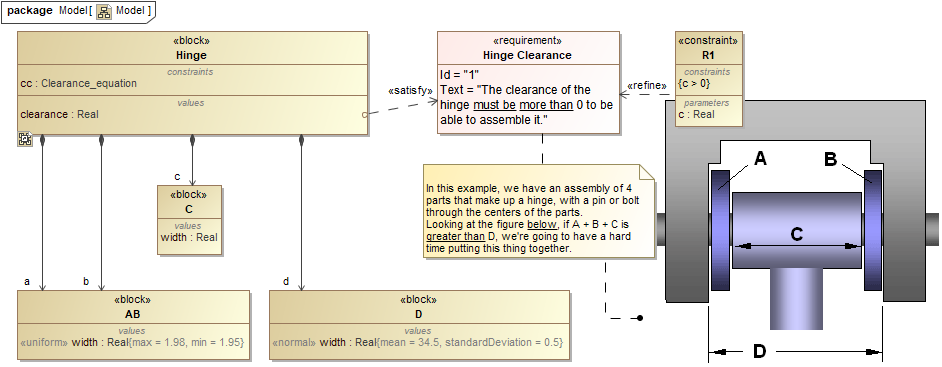
- Transform the stochastic model: D > A+B+C (random components) to the deterministic model: D-(A+B+C) > 0.
- Create the system model and Parts with a Block Definition diagram with required value properties, e.g., Blocks Hinge, AB, C, and D.
- Create constraint Blocks with parameters and constraint specification according to the requirement, e.g., Clearance_equation, R1, and R2.
- Create a Requirement with a satisfy Relation to the value property to keep the result for the constraint, e.g., Hinge Clearance and Unassemblable.
- Apply a «distribution» Type to get a set of random inputs of the value properties of the Parts based on Requirements, e.g., «uniform» with max and min and «normal» with mean and standardDeviation.
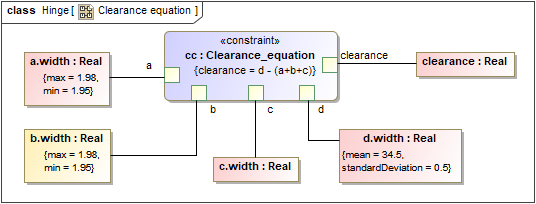
- Create a parametric diagram in the system to bind the value properties to the parameters of the constraint Block, e.g., Clearance equation.
Inheriting the Hinge Analysis Block from the MonteCarloAnalysis Block
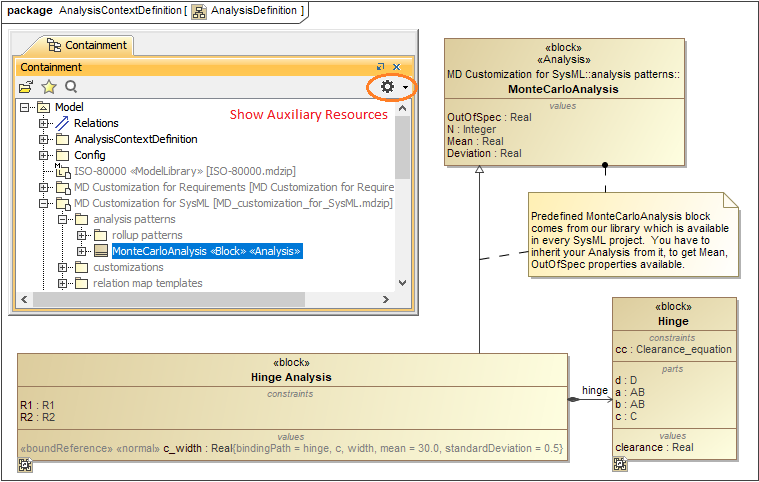
- Create another Block Definition diagram and include an analysis context definition by dragging the MonteCarloAnalysis Block from MD Customization for SysML::analysis patterns into the newly created Block Definition diagram, e.g., AnalysisDefinition.
- Create and inherit a new Block from the Block Definition diagram created in Step 1 as an analysis Block, e.g., Hinge Analysis, to get OutOfSpec, N, Mean, and Deviation properties. The inheritance can be done by creating a generalization Relation from the MonteCarloAnalysis Block to the system model Block (from the Creating a system model section).
- Create an association Relation, e.g., hinge, to make the Hinge system model block part of the analysis Block, e.g., Hinge Analysis.
Creating a parametric diagram and binding values
- To specify a parameter as the target of Monte Carlo analysis, create a parametric diagram in the analysis block to bind properties and constraints. The statistical value will be recorded in Mean as a result of the termination of the analysis loop, e.g., clearance.
- Connect constraints from Requirements to Mean for the Requirement verification and to OutOfSpec for the percentage of the samples whose Mean value violates any of the attached constraints or Requirements, e.g., R1 and R2.

Creating a Simulation Configuration diagram and configuring other settings
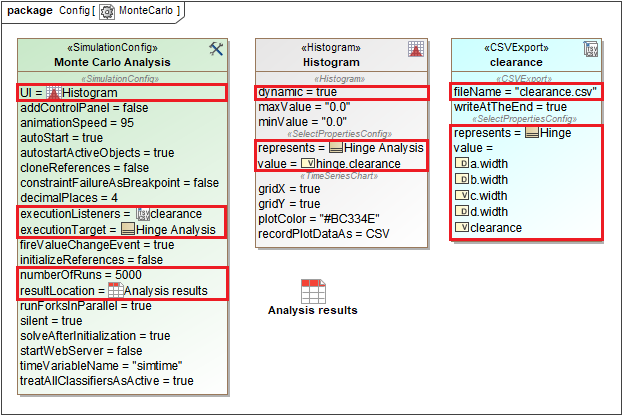
- Create a Simulation Configuration diagram, add a SimulationConfig to the newly created diagram, and set the following tags:
- executionTarget: the analysis block, e.g., Hinge Analysis Block.
- numberOfRuns: the number of runs, e.g., 5000.
- resultLocation: an Instance table, e.g., Analysis results.
- silent: true for the optimum performance of the simulation.
name (optional): e.g., Monte Carlo Analysis.
Note
- For a model that has Behaviors (Classifier Behavior and/or Part Property with Behaviors), see the autoStart tag in SimulationConfig.
- If numberOfRuns of any table (executionTarget) is more than 1, it will be ignored in the Monte Carlo simulation. The table, however, will be run only once.
- If silent is set to false, the simulation will run with animation and idle time for each iteration, which is not practical for the Monte Carlo simulation.
- Drag a Histogram control from the Simulation toolbar to the Simulation Configuration diagram. You can use the histogram as a local user interface by setting the following tags:
- represents: the analysis Block, e.g., Hinge Analysis.
- value: the monitored value property, e.g., clearance.
- dynamic: true for viewing dynamically updated statistical values (false will open the histogram at the end of execution).
- name (optional): e.g., Histogram.
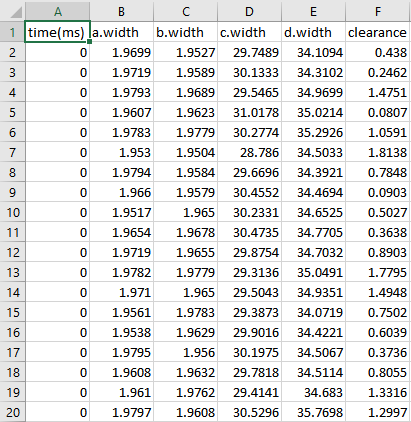
- Record generated value properties of every iteration using the CSV Export control by setting the following tags:
- represents: the system model Block, e.g., Hinge.
- value: related value properties, e.g., a.width, b.width, or clearance.
- fileName: the exported file name, e.g., clearance.csv.
- name (optional): e.g., clearance.
- Drag the Histogram and CSV Export controls to the «SimulationConfig». UI and executionListeners tags will be updated with the names of the Histogram and CSV Export controls accordingly, e.g., Histogram and clearance.
Running SimulationConfig and reviewing results
- Run the SimulationConfig from the previous section, e.g., Monte Carlo Analysis.
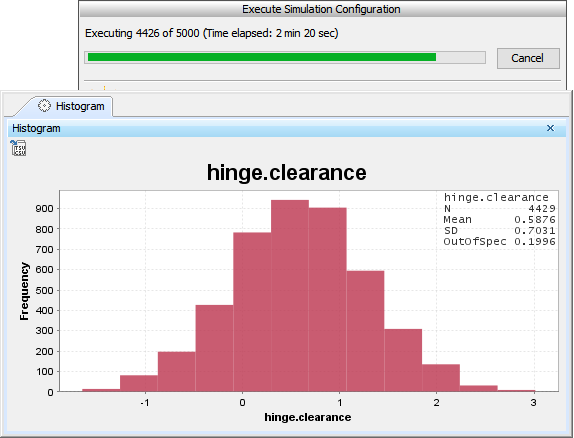
- During the simulation, the histogram will dynamically show the estimated distribution of the values of the analysis context definition at the top right, e.g., hinge.clearance, N, Mean, SD, and OutOfSpec.
- The simulation progress bar will be shown with the number of iterations and time elapsed. You can click Cancel to terminate the simulation, and the analysis result will be saved at the terminated iteration.
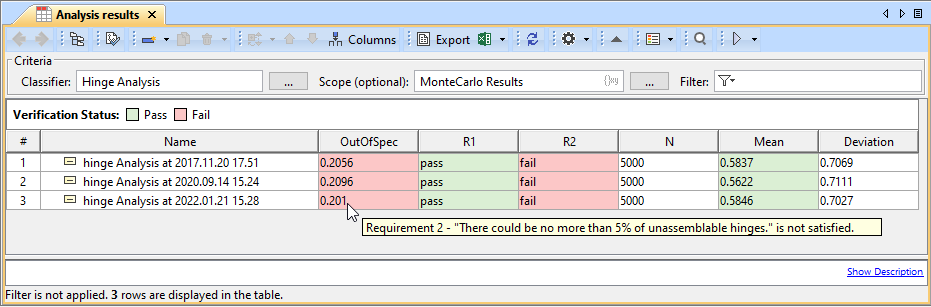
- The summary result is recorded in the Instance table along with «VerificationStatus» between value property and constraint, e.g., Mean-R1 and OutOfSpec-R2. You can also see the details of both failed and passed constraints in the tooltip when hovering the mouse over any highlighted values.
- Sampling results of value properties from applied distributions stereotypes are exported to the CSV file in the same location as the project. The file can be accessed through the link, e.g., clearance.csv, in the Console pane.