You can display the Time Series and Timeline charts along with the standard UI modeling diagram on the web user interface. You are required to generate the respective HTML files before generating the charts. To learn more about generating the HTML files, refer to Auto-generating HTML files.
If the Start Web Server property is set to true, HTML chart files are automatically generated.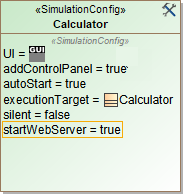
To plot on the web-based UI
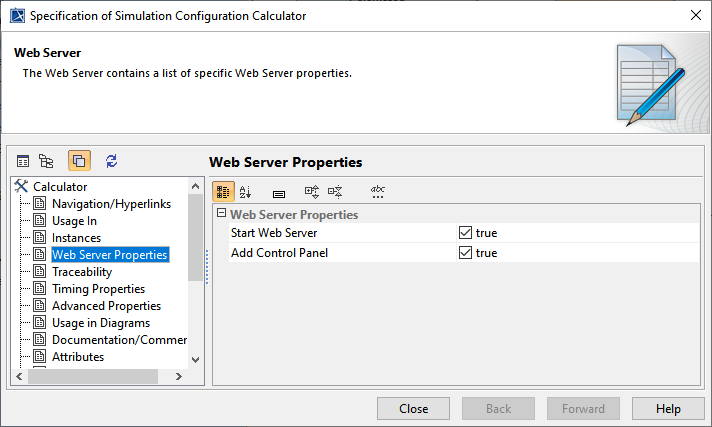
- Open the Specification window of a Simulation Configuration.
- Set the Start Web Server property to true to start the Web Server and close the dialog.
- Run the simulation.
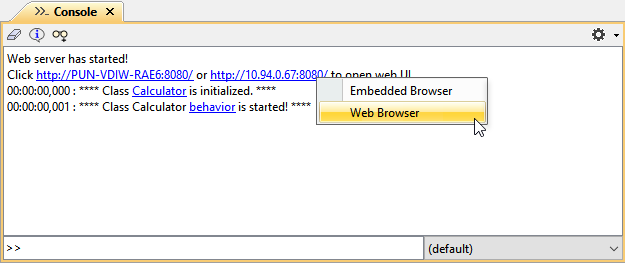
- Click the URL that appears in the Console pane when the model simulation is running. Select Web Browser to open the web UI.
The charts in the web and embedded browsers are the same. If the values in the simulation UI change, the corresponding chart is updated accordingly. The layout of the charts is auto-aligned with the chart properties of the runtime UI.
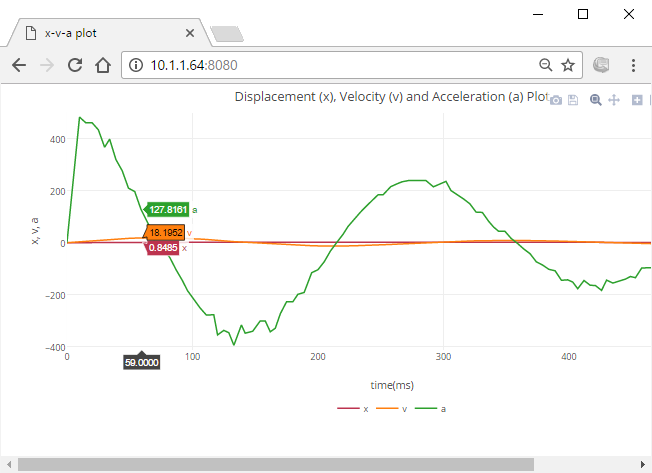
The Time series on the Web UI representing the values that correspond to those of the charts in the simulation UI.
