On this page
Description
An Activity diagram falls under the behavioral diagramming family. An Activity diagram is a variation of a State Machine. In the State Machine, the States represent the performance of Actions or subactivities, while the Transitions are triggered by the completion of the Actions or subactivities. It represents a State Machine of a procedure itself. The entire Activity diagram is attached through the model to a Class (such as a Use Case), to a Package, or to the implementation of an Operation. The purpose of this diagram is to focus on flows driven by the internal processing as opposed to external events. Use the Activity diagrams in situations in which all or most of the events represent the completion of internally-generated actions, i.e. procedural flow of control. Use the ordinary State diagrams in situations in which asynchronous events occur. An Activity diagram is a variant of a State diagram. Organized according to Actions, the Activity diagrams mainly depict the internal behavior of a method, i.e. the implementation of an Operation, or a Use Case.
Although Activity diagrams are often associated with interaction diagrams, they focus more on the work performed by a system, rather than an object interaction. An Activity diagram captures Actions and displays their results.
A State diagram may also represent this sequencing of steps. However, given the procedural nature of the implementation of the operations in which most events simply correspond to the end of the preceding activity, it is not necessary to distinguish States, activities, and Events systematically, e.g. a State change and external events are less important inside the method. Therefore, it is beneficial to have a simplified representation for directly displaying activities.
The Activity diagram provides a convenient way to describe complex algorithms, parallel operations, and business processes. Together with the Communication and Sequence diagrams, they are used to relate Use Cases.
You can create a new activity diagram under the following elements: Action, Structured Activity Node, Expansion Region, Conditional Node, Loop Node, Sequence Node.
The following functionalities help you work in an Activity diagram:
Behavior Creation Mode
You can use the Behavior Creation Mode to automatically create an Activity after creating a Call Behavior Action in the Activity Diagram. The newly created Activity will be set as the behavior of the Call Behavior Action.
To turn on the Behavior Creation Mode in an Activity diagram
In the diagram palette, click
 .
.The Behavior Creation Mode works separately for each project.
When the Behavior Creation Mode is on:
- A Behavior is created together with the Call Behavior Action. It inherits the type of the Call Behavior Action owner.
- If a Call Behavior Action and its Behavior are not titled, type a name on the Call Behavior Action shape on the diagram, and the typed name will be set as the Behavior's name automatically.
Smart layout
Dynamic centerlines
The centerlines are displayed only when the center of the shape that was moved or newly drawn is located near the center of a preexisting shape in the diagram. These lines help you to easily align shapes when drawing a diagram.
When the center of the shape that was moved coincides with a center of any shape that is placed to its right or left, a horizontal centerline appears. When the center of the shape is close to any center of a shape that is located above or below it, a vertical centerline appears.
To switch off the dynamic centerlines
- Click the Show Centerlines button
 in the diagram toolbar, or press C.
 - From the Options main menu, select Environment. In the Environment Options dialog, click the Diagram category, and clear the Show Centerlines in Flow Diagrams check box in the Display properties group.
Diagram orientation
The diagram orientation is used to assign the correct rectilinear path breaks and draw paths between the Activity diagram shapes. The paths can be drawn from side to side, or from the lower to the upper shape borders.
Example
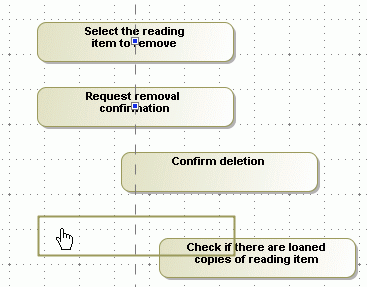
If you have a vertical diagram orientation and shapes are not in the same centerline, the paths will be connected from the lower border of the first shape to the upper border of the next shape, adding break points: 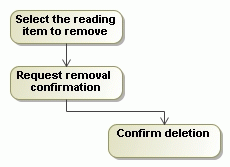
If you have a horizontal diagram orientation, the paths will be connected from the side border of the first shape to the next side border of the second shape, adding break points: 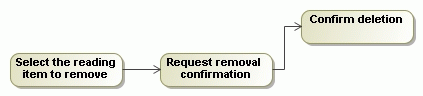
- From the Options main menu, select Project. In the Project Options dialog, expand Symbol Styles > Default > Diagram group (if it is not expanded by default) and, in the options list, change the value for the Diagram Orientation property.
- From the diagram pane shortcut menu, select Diagram Properties, or press Shift+Enter to open the Diagram Properties dialog. Change the value for the Diagram Orientation property in that dialog.
Deleting from Activity diagrams
- Note that after deleting the last symbol of an element from the Activity diagram, the element will be automatically removed from the model. This does not affect Pins and Activity Parameter Nodes.
If a Call Behavior Action that has an assigned Behavior is deleted from the Activity diagram, then this Behavior is also deleted from the model.
This is valid if the assigned Behavior is editable and does not have more usages, i.e. there is not a Call Behavior Action that has a reference to this Behavior.
Displaying inner elements
To display inner elements
- When creating a new Activity diagram, right-click an Activity in the Containment tree, point to Create Diagram, and then click Activity Diagram.
Inner elements are displayed on the Activity diagram pane automatically upon creating the first diagram under the Activity element.
- When modifying a previously created Activity diagram, select a diagram pane and do one of the following:
- From the shortcut menu, click Display > Display Inner Elements.
- On the diagram toolbar click , and select Display Inner Elements.
Related pages