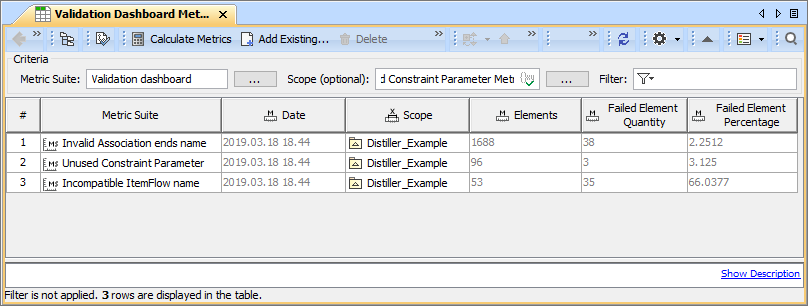
If you have several Metric tables where you calculate metrics using Metric Suites with validation-based metric definitions, you can display the validation results from these tables in a validation dashboard.
To create a validation dashboard follow these steps:
- Create Metric Suites for validation rules you want to track and create Metric Tables to calculate validation results.
- Create a validation dashboard that displays metric values from the Metric Tables created in the previous step.
Creating Metric Suites and Metric Tables to track in a validation dashboard
You can calculate model validation results in Metric Tables based on Metric Suites with validation-based metric definitions. Metrics calculated in these Metric Tables can later be displayed in a validation dashboard to track all validation results in one place. Follow the steps below to create Metric Suites and Metric Tables for a validation dashboard.
To create Metric Suites for a validation dashboard
Create a Package to store your Metric Suites.
Create a Profile Diagram and name it (e.g., Metric Suites).
In the Profile diagram, Create a Metric Suite using the BaseMetricSuite for each validation rule you want to track.
Create validation-based metric definitions for the Metric Suites created in the previous step.
Example of a Metric Suite that tracks a validation rule
For example, if you want to track the Unused Constraint Parameter validation rule, you can create a Metric Suite named Unused Constrained Parameter with the following validation-based metric definitions:
- Validation-based metric definition named Constrained Parameter with the Type property set to Integer, Validation Rule property set to Unused Constrained Parameter, and the Metric Type property set to Element Quantity.
- Validation-based metric definition named Unused Constrained Parameter with the Type property set to Integer, Validation Rule property set to Unused Constrained Parameter, and the Metric Type property set to Failed Element Quantity.
- Validation-based metric definition named Unused Constrained Parameter Percentage with the Type property set to Real, Validation Rule property set to Unused Constrained Parameter, and the Metric Type property set to Failed Element Percentage.
- Create a Metric Table for each Metric Suite created in step 3 and calculate metrics.
Creating a validation dashboard
A validation dashboard is a convenient way to track model validation results in one place. It displays metric values from multiple Metric Tables created from validation-based Metric Suites.
To create a validation dashboard
- Open the Profile Diagram in which you created Metric suites with validation based metric definitions (see step 2 in Creating Metric Suites and Metric Tables for a validation dashboard).
- In the Profile diagram, Create a Metric Suite using the BaseMetricSuite and name it (e.g., Validation Dashboard).
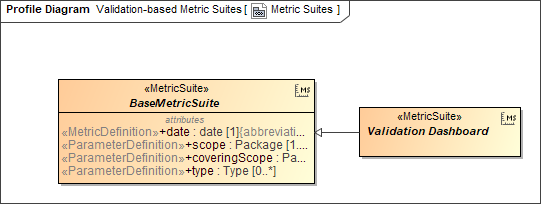
- Open the Specification window of the newly created Metric Suite (e.g., Validation Dashboard Metric Suite, as displayed above) and set the Is Abstract property to true.
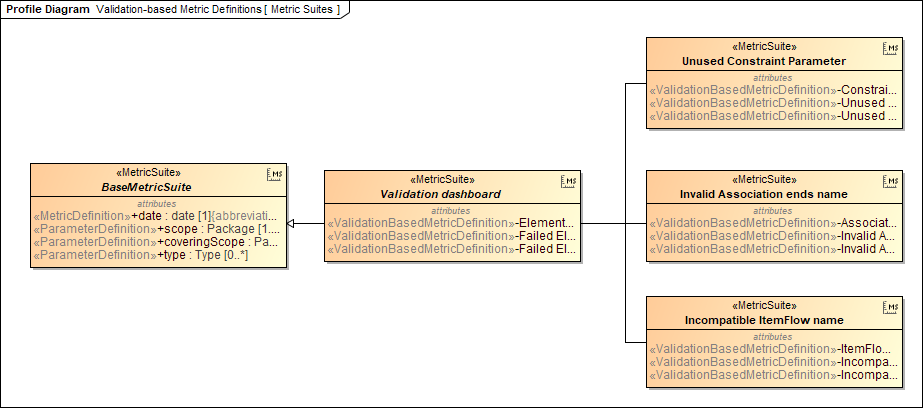
Build validation-based metric definitions for the Metric Suite to define the structure of the dashboard. Each validation-based metric definition represents a column in the validation dashboard.
Example of validation-based metric definitions
For example, if you want to create a validation dashboard with the Elements, Failed Element Quantity, and Failed Element Percentage columns, create the following validation-based metric definitions:
- Validation-based metric definition named Elements with the Type property set to Integer and the Metric Type property set to Element Quantity.
- Validation-based metric definition named Failed Element Quantity with the Type property set to Integer and the Metric Type property set to Failed Element Quantity.
- Validation-based metric definition named Failed Element Percentage with the Type property set to Real and the Metric Type property set to Failed Element Percentage.
- In the same Profile diagram, create a Generalization relationship from each Metric Suite that you created to track a validation rule (step 3 in Creating Metric Suites and Metric Tables to track in a validation dashboard) to the abstract Metric Suite created in step 2.
- Link each validation-based metric definition that calculates the metric you want to display in the validation dashboard to the metric definition representing a specific validation dashboard column (see step 4), as described below:
- Open the Specification window of the validation-based metric definition that calculates the metric you want to display in the validation dashboard.
- Select the specification cell of the Redefined Property property and click
 .
. - On the left side of the Select Property window, find the abstract Metric Suite created in step 2 and select its metric definition representing the validation dashboard column in which you want to display the metric.
Click
 to add the metric definition to the Selected elements area. Click OK.
Example of linking a validation-based metric definition
Let's say you have the Unused Constraint Parameter Metric Suite with the Constraint Parameter validation-based metric definition that calculates the number of constraint parameters. If you want to display the number of constraint parameters in the Elements column of the validation dashboard, you must open the Specification window of the the Constraint Parameter validation-based metric definition, and select the Elements validation-based metric definition of the abstract Metric Suite (created in step 2) as the value of the Redefined Property property.
- Repeat steps a through d for each validation-based metric definition calculating the metric you want to display in the validation dashboard.
- Build the validation dashboard:
- Create a Metric Table that will be your validation dashboard.
- In the Metric table, click
 next to the Metric Suite box.
 - In the Select Metric Suite dialog, select the abstract Metric Suite created in step 2. Click OK.
- Open the Specification window of the Metric table.
- Select the specification cell of the Scope property and click .
On the left side of the Select Elements dialog, select the Metric Tables you want to track in the validation dashboard.
Selecting multiple elements
If you cannot select multiple elements, click the Multiple Selection button on the bottom of the Select Elements dialog.
Click
to add the selected Metric tables to the Selected elements area. Click OK.- In the Specification widow of the Metric Table, select the specification cell of the Query property and click .
On the left side of the Query dialog, select Create operation and click the Operation from Model operation on the right side of the dialog.
Enabling the Expert mode
The Operation from Model operation is only available in the Expert mode. To enable the Expert mode, click the Expert button on the bottom left corner of the Query dialog.
In the Select Opaque Behavior dialog, select the LatestMetricInstances Opaque Behavior. Click OK.
- On the left side of the Query dialog, select Element = unspecified located under the LatestMetricInstances1 operation and click the Reset button.
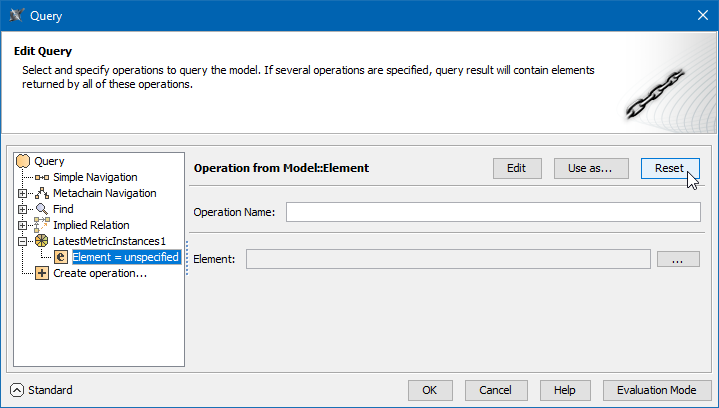
- On the right side of the Query dialog, select the Contextual Variable operation in the Other operation group and click OK.
- Close the Specification window of the Metric Table.
The latest instances from the specified Metric Tables are now collected and displayed in your validation dashboard, as shown below.