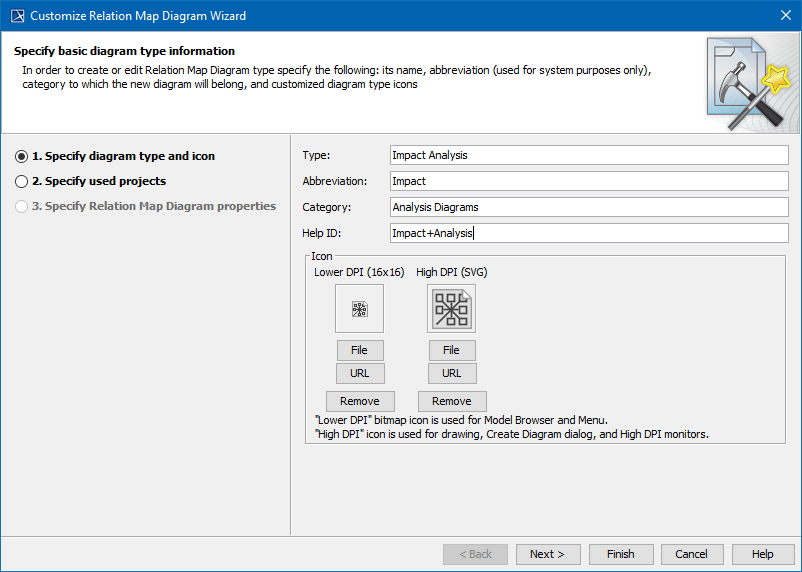
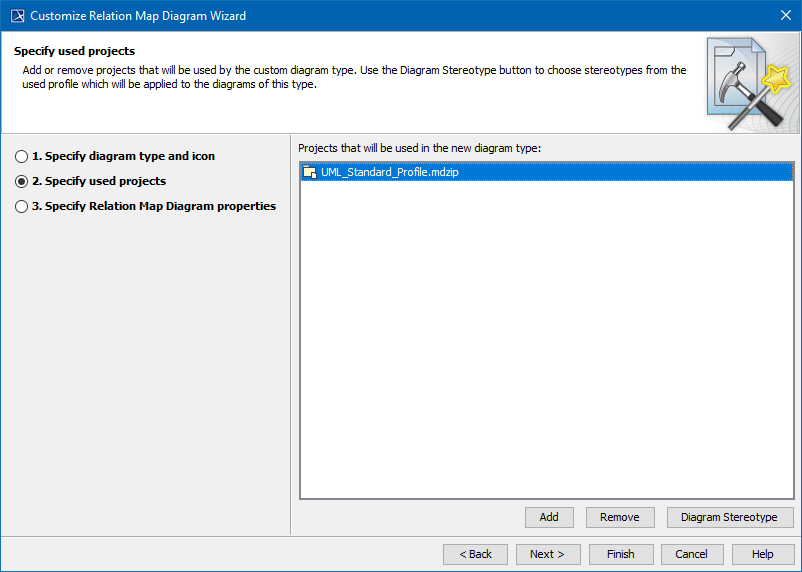
The Customize Relation Map Diagram Wizard contains the following steps for creating a new diagram type or modifying a chosen one:
Step 1: Specify diagram type and icon
To create your own diagram, first specify the following properties:
- Diagram type name (for example, Impact Analysis).
- Abbreviation – a short form of the diagram name. It will be used in Diagram Frames header or Diagram shapes in Content diagrams.
- Category – creates your specific category in the Diagrams menu or in the Create Diagram command list. You can store all your customized diagrams in this category. If you keep this field empty, the customized diagrams will be added to the Custom Diagrams category.
- Help ID – sets a specific Help ID that invokes help or documentation topics.
- Icons – several icons for your custom diagram representation in MagicDraw GUI.
Step 2: Specify used projects
Custom Diagrams are oriented to a new specific domain, technology or platform, and are often based on a custom profile.
Select the required used projects or profiles.
Do not remove the UML Standard Profile, which is selected by default, from the list. It must be used by any custom diagram type.
You can apply the stereotype for your Relation Map diagram by clicking the Diagram Stereotype button.
Step 3: Specify Relation Map Diagram properties
This step allows you to specify the appearance of the new relation map diagram.
| Property Name | Description |
|---|---|
| Cut Element Names | Set to true to cut element names that are too long and make the Relation Map difficult to read. |
| Include Subtypes | Set to true to display subtypes of the selected elements. For example, if a class is selected, then all its subtypes (such as component or custom subtypes like SysML block) are displayed. |
| Show Element Numbers | Set to true to show the element number before its name. |
| Show Legend | Set to true to display the relationship legend. |
| Show Parameters | Set to true to show the parameters' signatures of operation and behavior on symbols. |
| Show Single Node Per Element | Set to true to show a single node per element when the graph has more than one representation of that element in the Relation Map. |
| Show Applied Stereotypes | Set to true to display stereotypes applied to the elements. |
| Relation Criterion | Click ... to select and specify criteria in order to represent relations between elements. |
| Element Types | Click ... to select specific element types to be displayed. |
| Layout | Select Tree or Radial from the drop-down menu to customize the layout of your Relation Map. |
| Depth | Type the number to specify the level of the relation map branches that will be expanded automatically. |
| Filter Area Expanded | Set to true to show the filter area expanded. |
| Make Selected As Context | Set to true to make the selected element the core of the Relation Map. |
| Show Full Types | Set to true to show full element types in the Relation Map. |
| Show Relation Styles | Set to true to show relation line styles. |
| Description Area | Specify the description of the Relation Map. |
| Possible Context Types | Click ... to specify the possible context types. |
| Show Scope | Set to true to display the Relation Map scope, that is, to see the fragment of the model (or whole model) from which the Relation Map is built. |
| Show Context | Set to true to show the Context field in the diagram toolbar. |
| Show Element Type | Set to true to show the element type specification box in the diagram toolbar. |
| Show Relation Criterion | Set to true to display relation criteria in the diagram toolbar. |

