On this page
Product performance can be highly dependent on the model organization strategy. From long-term work experience with various clients, we have selected the biggest challenges and gathered their possible solutions in one place.
Teamwork Cloud Operations Specifics
Project Opening
Opening Teamwork Cloud project for the first time may take a bit longer, as all project-related data has to be downloaded from the server and then processed in the modeling client. The download time depends on the project size and network speed, e.g., for large projects (containing 5M/3.5M model elements in "19.0 and before/2021x and later" version), it may require downloading 1GB or more of data. Once the project is opened, we store your project data locally. The processing time depends on the downloaded project size. Opening the project for the second time is much faster as there is no need to request all data from the server again. Instead, the previously downloaded and locally stored data is reused. Only new information has to be downloaded from the server. The maximum processed data count is specified by the Recent Files List Size environment option. The processed project data is always preserved when the project is saved offline.
Committing
Frequent commits make it easier for other team members to track project changes; however, this should be avoided if many users are working on a particular project. Frequent commits create a lot of project versions and increase the commit time due to the need to update the project every time. You need to decide upon the best committing strategy within your company. A widely used practice is to commit the changes at the end of the work day; however, this should be avoided because, in some cases, the project commit may take longer than expected.
Switching Used Project versions
Teamwork Cloud projects are usually built from smaller parts. Different teams simultaneously develop different parts of the project, so there is a need to keep the model up-to-date. A user is notified when a new version of the used project arrives, and it is up to the user whether to apply the update or not. As not all used project version updates are important, there is no need to update the version each time a new version arrives. Therefore, it is best to set up a version update strategy within the teams. You can decide whether or not to switch to a new used project version by considering the severity of that version – the commit tags can be used to mark that the particular version contains the major changes and should be used instead.
More information can be found here.
In some cases, the project version update may take longer than expected due to a local cache update.
Used Projects Auto Update Plugin. This plugin allows users to set up specific used projects to update. We recommend that you schedule it to launch at night so that the latest versions will be ready to use the next work day. More information can be found here.
Merge
To perform a merge operation, the ancestor and contributor (source and target) projects have to be loaded, meaning that the memory consumption increases at least two times compared to the memory required to perform daily tasks in the project. After testing the memory consumption with different-sized projects, the following minimum memory requirement for the merge operation was identified: 2 x (memory required to load project) + 1 GB*.
*these memory requirements are indicative and may vary by project. Strongly depends on the amount of detected changes between merged versions (in this case, the projects merge was done with 1.5k changes in total).
Since the merge operation uses a high amount of memory, please make sure that your machine is capable of performing this task. If the required memory exceeds the maximum amount of memory that can be allocated to the tool, the dedicated hardware should be used instead. In case of excessive memory usage, the merge operation can be optimized for lower memory consumption by excluding differing diagrams/elements count (Optimize for > Memory in the Merge Projects dialog); however, this optimization slows down the merge operation.
Project Decomposition
Model partitioning enables a more granular model management. Despite the benefits of granularity, project decomposition should be done carefully since managing used projects can become a bottleneck from a performance perspective. Please follow the criteria below to decompose a project:
20+ active users work on the same project simultaneously. As a result, the project contains many project versions, which slow down project history-related operations. Also, a higher number of users leads to a higher number of commits, resulting in longer update times and slowing down the commit operation.
A large number of models owned by the same person indicates that the model granularity is too small or there is a need to distribute responsibilities.
- The part of the project (such as type libraries) should be used in other projects.
- Different teams work on a certain aspect of the system separately. All these separate parts are then connected in the integration project.
Publishing projects to Cameo Collaborator for Teamwork Cloud
As publishing greatly depends on the element count and diagrams complexity (e.g., diagram type, a number of elements displayed, dynamic or static content, etc.), please consider the publishing scope before publishing. Since publishing uses a high amount of memory, please make sure that your machine is capable of performing this task. Remember that if the required memory exceeds the maximum amount of memory that can be allocated to the tool, the dedicated hardware should be used instead.
Content History
If retrieving a particular element history takes a lot of time, it implies that the Content History action should be performed carefully as it retrieves the history of all contained elements at once. Before invoking this action, you should carefully consider the scope of the elements contained by the element for which the action is invoked.
Teamwork Cloud Operations Troubleshooting
Waiting for Response
If the operation that requires a remote call to Teamwork Cloud is taking too long, you can analyze a .log file to learn how much time was spent processing the operation in the client and server-side.
Where do I find a .log file?
- Open your modeling tool.
- In the main menu, go to Help > About <modeling tool name>.
- In the Environment tab, click the file path next to Log File to open a .log file.
Measuring Network Latency
INFO NetworkPerformance - <operation name> latency <latency time>
Description
The latency (i.e., the time it takes for the ping signal sent from the tool to the server to return) is measured for the following operations:
- Login
- Committing project to server
- Updating project
- Opening project
Example: INFO NetworkPerformance - Login latency 1 ms
Remote Operations Duration Statistics
INFO RemoteCallsAnalyzer - <operation name> all operations time <total operation time>
INFO RemoteCallsAnalyzer - <operation name> calls total time: <total time, spent in remote calls>, start count: <remote calls count>, failed count: <failed remote calls count>
Description
The remote and local operations duration statistics are collected for the following operations:
- Updating from local project
- Opening Manage Projects dialog
- Opening Open Server Project dialog
- Updating project
- Committing changes to a server project
- Setting selected version as latest
- Cloning project
- Managing version properties
- Opening Teamwork Cloud project
- Renaming project
- Removing project
- Adding project to server
- Viewing element history
- Comparing projects
- Using server project
- Discarding changes
- Locking and unlocking elements/diagrams
- Changing used project version
Example:
- INFO RemoteCallsAnalyzer - Manage projects all operations time 9797 ms
- INFO RemoteCallsAnalyzer - Manage projects calls total time: 2293 ms, start count: 47, failed count: 0
Common Features
Validation
The validation engine helps to keep the model accurate, complete, and correct. Since model checking is a complicated task that greatly depends on the project size, please consider the following recommendations to keep the modeling tool running smoothly:
- Validate Only Visible Diagrams to limit a validation scope to visible diagrams only. Since 2021x version, all projects are migrated to validate only visible diagrams. This is a key option to keep the modeling tool running smoothly while working on large models.
- Exclude Elements from Used Read-Only Project to skip the validation of elements used projects contain.
- Set the Validation Scope to narrow down the list of validated elements.
Querying the Model
Ineffectively written queries can cause showstopper problems, especially when a project becomes quite large. The most attention should be paid to Script, Find, and Find Usage in Diagrams operations. Be aware that the slow execution of queries can noticeably impact the modeling experience - some operations trigger an expression (e.g., smart packages and derived properties) recalculation.
- The Find operation should not be performed for the whole project scope when specifying expressions for smart packages, derived properties, validation rules, etc. Since the operation is highly dependent on the search scope - the wider it is, the longer it takes - it can noticeably impact the modeling experience by slowing down the common modeling tool commands that, as a result, cause the expression recalculation.
- In addition, it is not a good practice to use Find for searching common elements (e.g., Class, Package, Block, etc.). The similar is valid for searching element usages in diagrams. Since the operation searches for usages in dynamic content, such as tables, the operation performance slows down. To find the usages, each table in the project has to be built. This implies that the operation is highly dependent on the complexity of the table scope query and the total number of tables in the project.
- Smart Packages specifics:
- The Use In Selection Dialogs option (removed since 2021x) - set to false if a slow-running query is defined;
- Avoid nesting smart packages, i.e., using one smart package as the part of another smart package's content.
- Use Java and StructuredExpression instead of Script, if possible The table below shows how the Legend item condition execution time differs by performing the same expression in different languages:
Language | First time execution on diagram (ms) | Second time execution on diagram (ms) |
|---|---|---|
| Java | 80 | 40 |
| Groovy | 1488 (groovy initializes) | 120 |
| Structured Expression (Property Test) | 450 | 200 |
| OCL | 1401 | 200 |
| JavaScript | 1672 | 880 |
| JRuby | 1420 | 1210 |
| Jython | 12162 | 8000 |
Table comparing the Legend item condition execution time by language.
Troubleshooting
When working with large projects, smart packages can sometimes cause performance issues. They can have an impact on search, commit, and derived properties-related operations time. You can identify which smart packages or properties cause the problem by receiving notifications about their evaluation time. To receive notifications about the evaluation time of smart package content and derived properties:
- Go to <modeling tool installation directory>/bin and open the properties file of your modeling tool.
- Enter the md.expression.evaluation.duration.notification.threshold Java argument and define the threshold time in seconds for getting notifications, e.g.,: -Dmd.expression.evaluation.duration.notification.threshold=30
- Save and close the file
Restart your modeling tool if it is open.
Note
The default value of the md.expression.evaluation.duration.notification.threshold argument is 60 seconds. If you add the argument to the properties file of your modeling tool but do not define its value, the default value is used.Your modeling tool is now configured to show notifications about the evaluation time of smart package content and derived properties. The notifications are shown in the Notification Window area at the bottom of a modeling tool window.
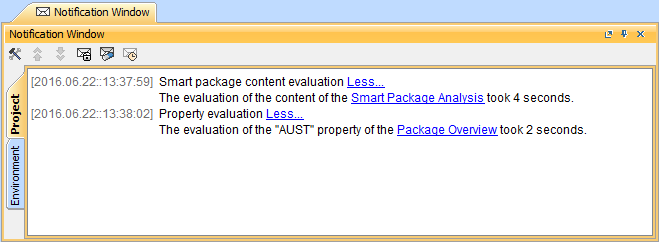
Smart package content and property evaluation notifications - the time threshold applied is 1 second.
Diagrams
The consumed memory increases while working with the project for some time. One of the reasons is the number of open diagrams. As high memory usage becomes a problem, we recommend that you do not keep unused diagrams open. To prevent from keeping a large number of open diagrams, beginning with version 2021x, the open diagrams limit was introduced with 20 diagrams set as the default value.
Please find below how memory consumption increases depending on the size of a diagram/table:
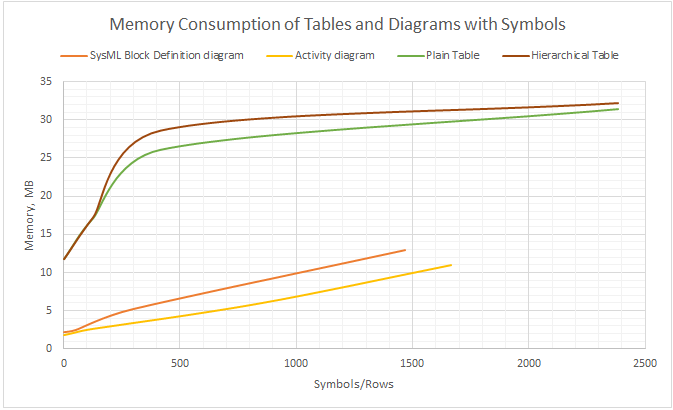
Chart depicting memory consumption by diagram size (symbols/rows displayed in a diagram/table).
- The matrix/table building time greatly depends on the specified scope - the wider it is, the more time it takes to build the matrix/table.
Please avoid setting the entire model as the scope even if the matrix/table building performs well, as it can cause unacceptable performance in the following circumstances:
- a project containing such a table/matrix is used in another project;
- a large number and/or ineffectively written queries of smart packages. Even if a smart package is not set as the scope directly, this does not prevent the calculation of smart packages. The defined static scope can contain smart packages as inner elements. Since each inner smart package content is calculated, it can cause significant performance decrease while building a table/matrix, especially if a large number of smart packages exist within the specified scope. What is more, since smart package content is automatically updated, it can slow down many common modeling tool commands, such as elements creation, deletion, and update.
- Also, it is not advisable to choose more than 10 element types to be displayed because this may lead to a decrease in the matrix/table building time. Since matrices/tables have an option to define a scope query, the Smart Packages should not be set as scopes as well.
Working with Model Browser
The organization of the model is determined by the package hierarchy you create to partition the elements in the model into logically cohesive groups. This affects the model browser performance as well - to avoid sluggish browsing in Containment Tree, you need to organize your model to avoid 10k and more directly owned elements by the particular element. Since containment model browser is a lazy tree, it calculates and represents the nodes during expanding the owner. The big number of owned elements can cause unexpected waiting time to complete the task. So, we recommend to split elements by creating different packages.
Virtual Environments
- Two issues have been identified in VMWare ESX environments. To help prevent problems on the Teamwork Cloud side, we have come up with recommended hardware configurations.
- Overcommitting of resources. The same host has an over-allocation of CPU/RAM. The bigger problem is the over-allocation of RAM. For example, let's say a machine has 1TB of physical RAM. You allocate more than 1TB across various VM's in the host. What happens is that the RAM is no longer physical RAM, but rather mapped to disk, so performance decreases. Xen (Citrix) and KVM do not allow you to overcommit. In these you can allocate min/max, but never to exceed the physical RAM, and as more instances start using up the RAM, the system reduces the allocated memory.
- Thin disk provisioning. This arises from an over-allocation of disk resources. Let's say you have a given amount of disk space to be used among VM's. In many cases, the admin does not know how much the actual disk usage is required per machine. Some VM's may use more, some less. Therefore, you over-allocate the storage using the thin provisioning. Under the thin provisioning, only the amount of storage being used is allocated to the virtual disk. As utilization increases, the virtual disk (which is a file) grows. This, however, has a negative impact on the performance of input/output intensive applications like databases. For Cassandra, it is a killer in performance because compaction can potentially temporarily double the on-disk size. All disks must be thick provisioned.
- The other item is that at the very least you need to be using SAS-SSD. If using SAS-SSD, the host needs to have high end caching controllers. On the Teamwork Cloud side, the core count is important - the more cores, the better.
- SAN's are not recommended. Only NVMe (all flash storage) will provide the necessary performance for large installations, provided that they are properly configured and that enough bandwidth is allocated to the instances.
- It is recommended that you stay away from Windows deployments. There is no freely available Cassandra Windows installer.
- If we look at cloud hosting, the older instances in Amazon use the Xen hypervisor (xcp), whereas the new ones use the kvm hypervisor. These are the instances you should use: preferably, the NVMe based i3 instances, next would be r5, and finally m5. What is critical is to properly provision the filesystem.
- On the client side, the same issues of resources over-allocation can be a performance killer. Thin provisioning affects performance because disk caches are used extensively. Therefore, what is more important when using VDI's is working on machines that have faster processors. When provisioning the VDI's, we do not recommend that you allocate a lot of CPU's because they will not be used. It is important to have the fastest processors.
Antivirus
Since some antivirus software can cause significant performance decrease upon opening a project and performing other actions, we recommend that you exclude the MagicDraw home directory from the antivirus scanning scope.