Released on: August 4, 2015
Integration with Cameo Enterprise Data Warehouse
We are proud to offer our users the integration with Cameo Enterprise Data Warehouse (CEDW), a new server for collaborative development and versioned storage of models. CEDW is envisioned and architected to provide significant future improvements in the areas of model-governance, model-analysis, and integration with third-party tools.

What are the differences between working with CEDW and MagicDraw Teamwork Server?
- Faster project opening*.
- Scalable server performance (server can be expanded to a cluster).
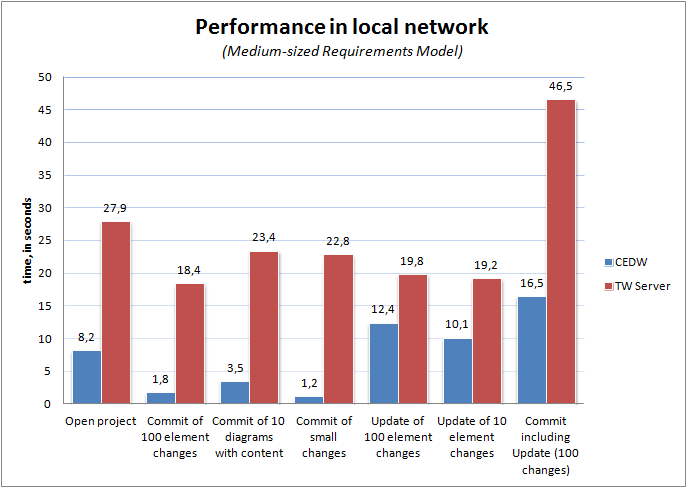
- Faster commits and updates of project changes.
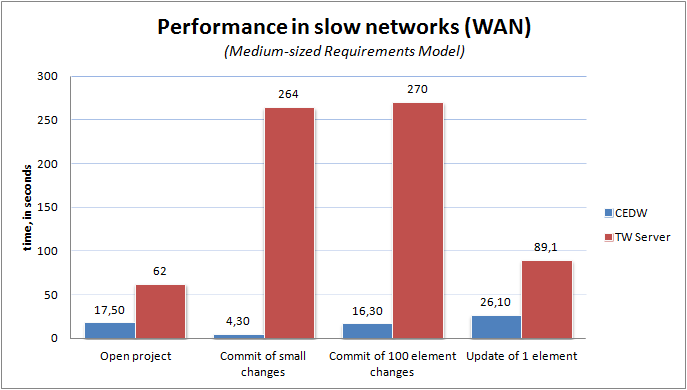
- Faster team collaborations when server is located at MAN/WAN.
- Redesigned project composition of used projects.
- Model versioning with the built-in database.
- User authentication against LDAP server (multiple directories supported).
- Role-based access control (RBAC) with predefined set of roles for the server and project access management.
- Easier administration of the server and server-stored models via the web browser.
--
* After the project is cached locally, all later project loadings lasts only several seconds.

Increased Modeling Efficiency
We are pleased to introduce validation and Relation Map enhancements, smarter diagram layout, transparent unconnectable shapes, and many more features that save modeler's time and allow focusing on what to model, but not how to model and keep the result well-formed.
Validation enhancements
Visible diagrams validation mode
Feel like validation of your model runs too slow? Going to stop it? Then switching to the visible diagrams validation mode is what you need! As a result, the active validation starts running only on elements displayed in one or more visible diagrams, which significantly increases the performance of the modeling tool.
Validation results marker bar
When your diagram is too large to be displayed all-over, it may become quite challenging to notice all annotated symbols it contains. In this case the new validation results marker bar is your true helper! It appears on the right side of a diagram pane, if the diagram contains annotated symbols.
The markers are shown even for the items that are not currently visible on the screen (you may need to scroll down to see them). The marker bar is shrunken to fit the screen and displays relative positions of annotated symbols on the axis of ordinates. Every marker is colored according to the violation severity.
You can click a marker to select the annotated symbol or move the mouse over the marker eye (at the top-right corner of the diagram pane) to see the summary of the diagram validation results.
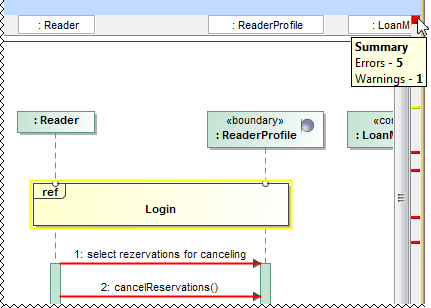
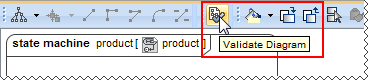
Diagram validation button
Need to validate only a small portion of the model you just have modified in a diagram, table, matrix, or relation map? Click the new button on the toolbar of this diagram, table, matrix, or relation map to run the validation only there.
Smarter diagram layout
- The new Shape Order option coming with the Hierarchic Layout allows you to specify the order of laid-out shapes, thus making the creation of Requirement diagrams more convenient and time-effective. Now you can arrange your shapes by name or by numbering.
- A new, separate Grid Layout has been created to enable you to layout elements in a COMPACT grid. Its options allow ordering elements by a defined comparator, and also the definition of aspect ratio that the layouter can work on . The Grid Layout has the Make preferred size option; if true, elements are resized to the smallest possible sizes, if false, elements remain of the same sizes they are. The Minimal shape distance option determines the distance between shapes.
Transparent unconnectable shapes
Forget about considering which shape is suitable for connection! From now, on all the shapes that cannot be connected with the selected shape become less visible on the diagram pane.
![]()
You can specify the transparency of unconnectable shapes by changing the Transparency of Unconnectable Shapes property value in the Environment Options dialog, the Diagram property group.
Relation Map enhancements
The Relation Map can now display:
- Element numbers after you click the Option button on the Relation Map toolbar and then select Show Element Numbers.
- Standard and custom subtypes of the selected element type after you choose the element type and then select the new Include Subtypes check box in the Select Element Type dialog.
Plus, you're welcome to use the zoom buttons directly from the relation map toolbar!
Sub-categories in Project Options and Environment Options dialogs
We have updated the Project Options and Environment Options dialogs for your convenience – now when you open either of them, you see the General options grouped into sub-categories with links in the right side of the dialog. This saves you time from guessing where a certain option is, also it makes access to those options easier – simply click the link, and the chosen option sub-category will be selected in the tree and opened in the right pane.
Other News
Online documentation
It's our pleasure to announce that as of 18.2 FR, we are starting to move all our actual documentation online – to a single, user-friendly platform with advanced searchability.
For a limited time, you might notice this migration is in progress. This means that:
- At first, only 18.2 new features' documentation will be available in the new site.
- Temporarily, there will be no offline documentation for the 18.2 FR.
- Offline documentation accessible via Cameo Business Modeler is up to 18.1.
- Context-sensitive help (F1) will reference to 18.1 documentation.
We plan to provide the complete online documentation until the release of the next LTR.
We'd like to apologize for any inconvenience this migration may cause. Your patience and trust in us is what inspires us to look for even better solutions for our clients!
Optimization for high resolution displays
Now OS X users can take full advantage of a long-awaited Retina display support, allowing those who work with higher resolution screens to see more detail in diagrams and enjoy sharper icons in the interface.
Those who use Cameo Business Modeler for Windows and Linux with high resolution screens will definitely notice the initial steps taken towards full HiDPI support – you can now benefit from a significantly better overall visual quality, including proper scaling and increased sharpness of icons.
Eclipse UML 2.5 model data export
The Eclipse UML 2.5 model data export from and import to Cameo Business Modeler is now fully supported.
All available Eclipse UML 2 XMI formats – Eclipse UML 2 v2.x/v3.x/v4.x/v5.x/ XMI – are now listed under a single File > Import From / Export To command group Eclipse UML 2 XMI File.