On this page
Required *.json file:
The following components are deployed on each TWC/Cassandra node:
- Telegraf - system metrics collector
- Dropwizard metrics-graphite-3.1.2.jar - metrics publishing agent for Java
Install Telegraf
- Install Telegraf in the TWCloud/Cassandra node
- If you have not created the influxdb.repo as in step 1a of the Monitoring Mode, do so at this time.
Install with the command:
sudo yum install telegraf
- Edit /etc/telegraf/telegraf.conf as follows
- Locate the section titled "[[outputs.influxdb]]"
Edit the line with the urls = tag as follows:
urls = ["http://monitoringnode_ip:8086"] where monitoringnode_ip is the IP address of the node where infuxdb is installed (if it is located on the same machine, you may use 127.0.0.1).
Enable the Telegraf service on startup:
sudo systemctl enable telegraf
Start the Telegraf service:
sudo systemctl start telegraf
Restart the Teamwork Cloud service:
sudo service twcloud-svc restart
- Modify Cassandra to allow remote monitoring
- Download metrics-graphite-3.1.2.jar from http://central.maven.org/maven2/io/dropwizard/metrics/metrics-graphite/3.1.2/metrics-graphite-3.1.2.jar
Change permissions to allow execution:
sudo chmod 755 metrics-graphite-3.1.2.jar
- Copy metrics-graphite-3.1.2.jar to /usr/share/cassandra/lib/
Edit /etc/cassandra/default.conf/cassandra-env.sh, adding the following at the bottom:
# Enable metrics reporting to InfluxDB using the yammer library
METRICS_REPORTER_CFG="metrics-reporter-graphite.yaml"
JVM_OPTS="$JVM_OPTS -Dcassandra.metricsReporterConfigFile=$METRICS_REPORTER_CFG"
Create a file /etc/cassandra/default.conf/metrics-reporter-graphite.yaml with the following content:
graphite:
  -
    period: 30
    timeunit: 'SECONDS'
    prefix: 'HOST_NAME'
    hosts:
     - host: 'IP_ADDRESS'
       port: 2003
    predicate:
      color: 'white'
      useQualifiedName: true
      patterns:
        - '^org.apache.cassandra.+'
        - '^jvm.+'
- Replacing HOST_NAME with the Cassandra node's hostname, and IP_ADDRESS with the IP address of the monitoring node (where Influxdb is installed)
Restart Cassandra:
sudo service cassandra restart
Configure Grafana
- Configuring Grafana monitoring dashboard:
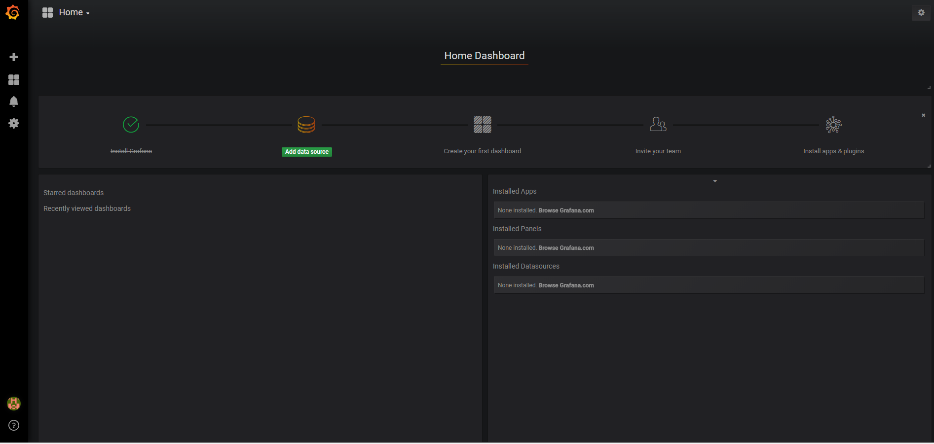
- Log into http://MONTORINGNODE_IP:3000 - you will be displayed the Grafana Login Screen - default credentials are admin/admin. Upon logging in, you will be prompted to change the admin password.
- You will be presented with the following screen, click Add data source:
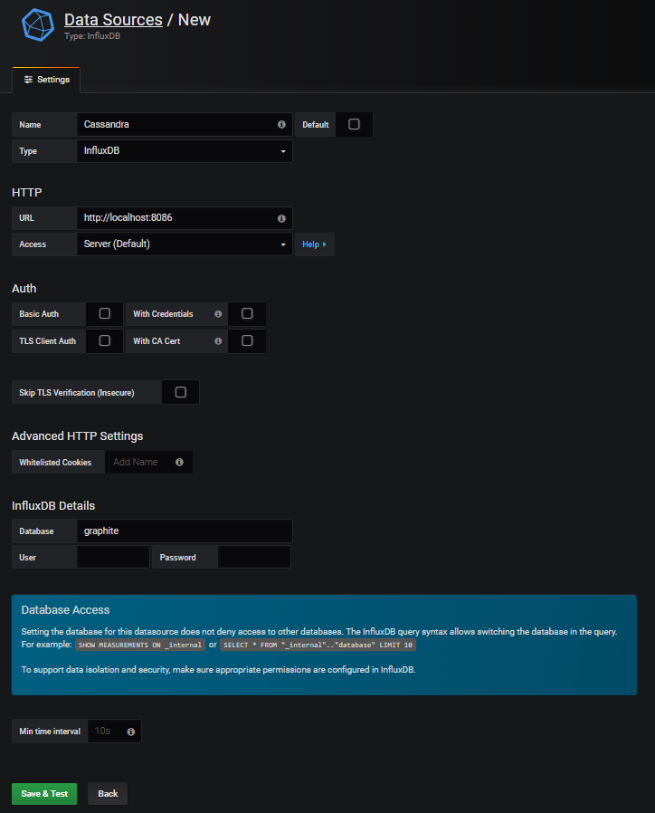
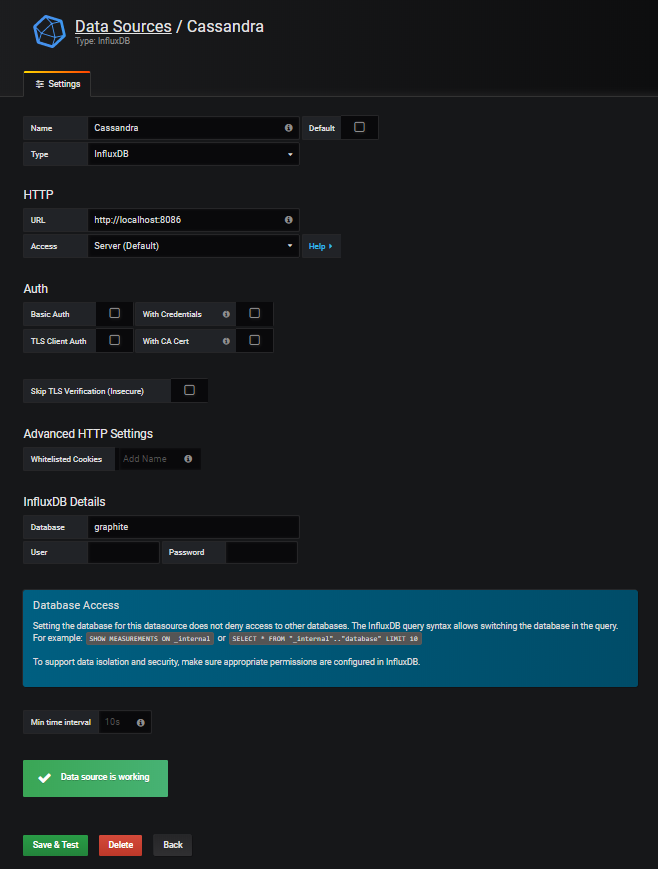
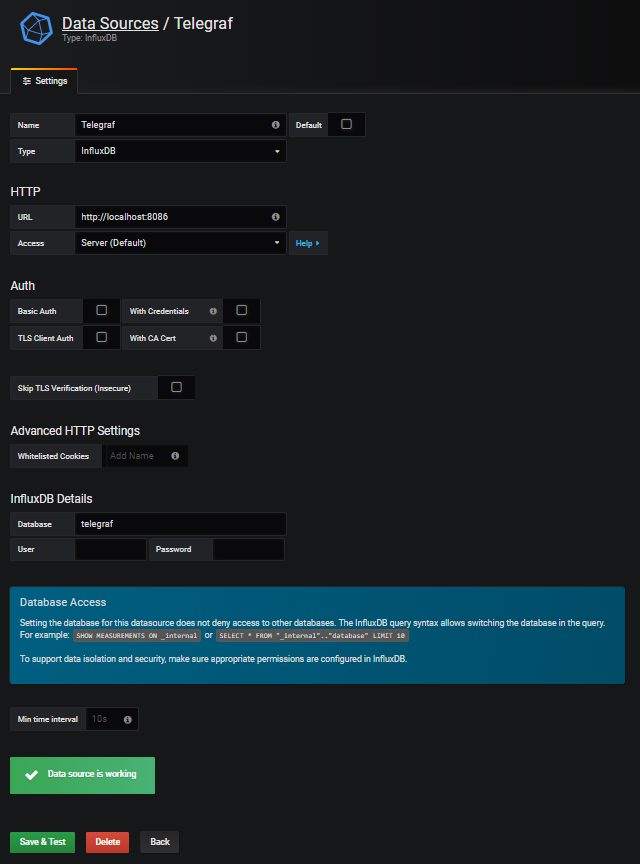
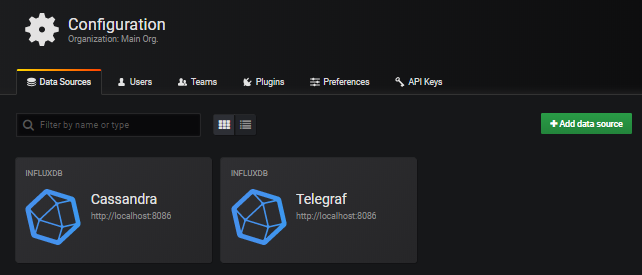
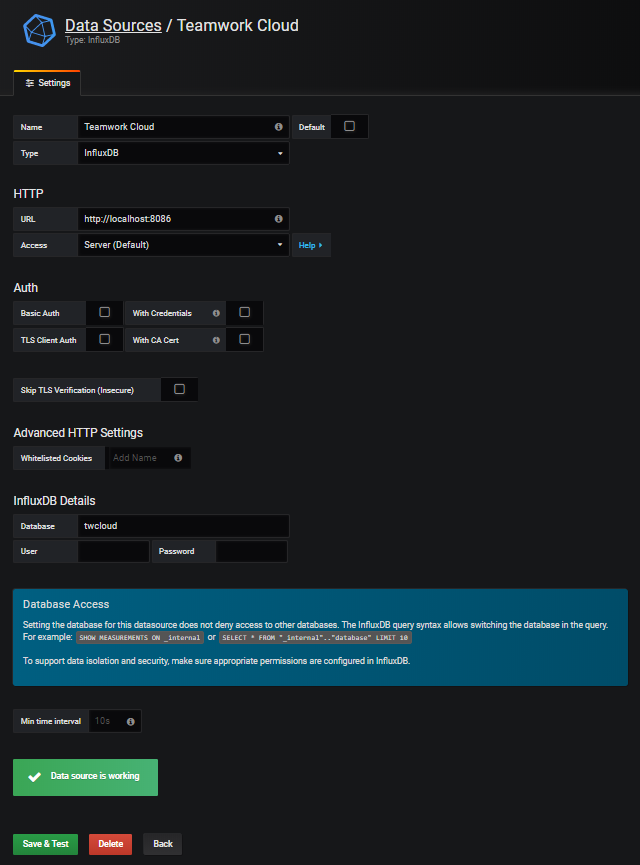
Create the data sources, enter the information as in the following screenshots, and press Save & Test for each. After the data source gets created, click the Data Sources link to continue adding data sources.
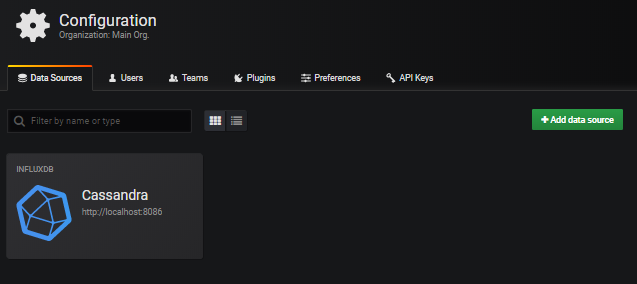
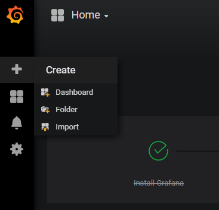
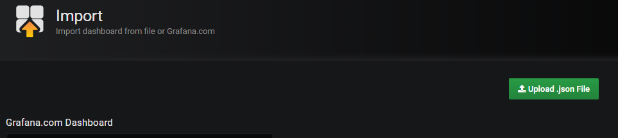
- Now that the data sources have been added, select the option to import a dashboard:
- To upload .json file, click the Upload .json File:
- Select the provided Teamwork_Cloud_Dashboard.json.
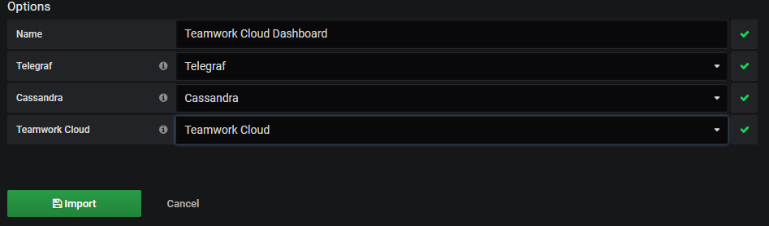
- At this point, you will be presented with the following screen, in which you will need to map the data sources:
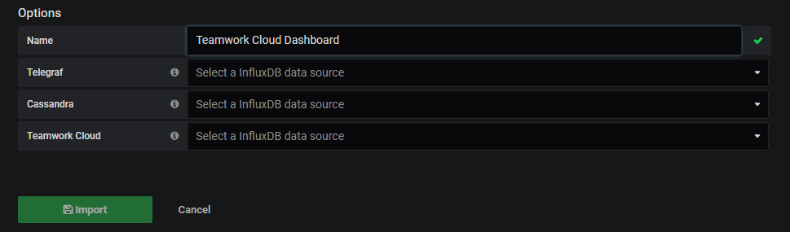
- Map the data sources as shown below and click the Import button:
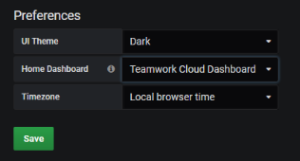
- To make the Teamwork Cloud dashboard your home dashboard, perform the following steps:
- Mark the Teamwork Cloud Dashboard as a favorite:

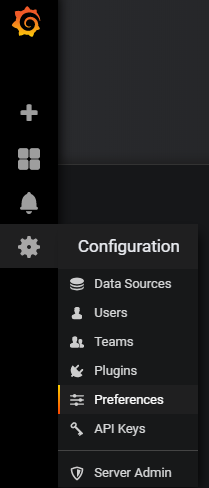
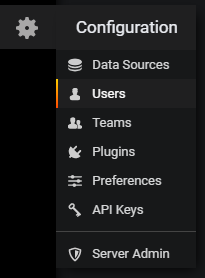
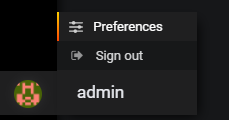
- Select Configuration > Preferences
- Select the Teamwork Cloud Dashboard to be your Home Dashboard and click Save.
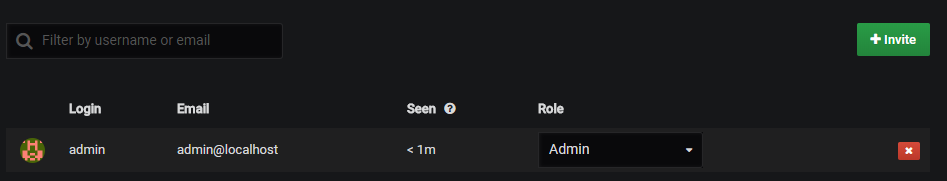
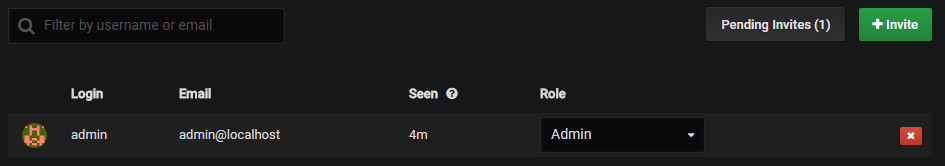
- The admin user has permissions allowing full access. Create a limited access user who will be allowed to view the dashboard without the ability to make modifications. Click Users.
- You will be presented with the following screen. Click Invite:
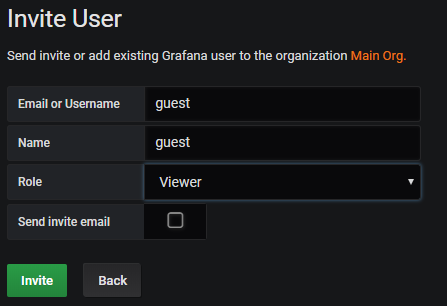
- Create a guest user by entering the information as below, and clicking Invite:
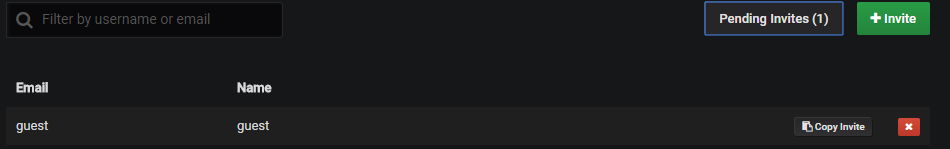
- You will be shown a screen as below. Click the Pending Invites button:
- Click the Copy Invite button:
- Paste the link which was copied to your clipboard on a new browser window, and replace "localhost" with the IP address of the monitoring node. You will be presented with the following screen. Change the email field from "guest" to "guest@localhost", enter a password and click the Sign Up button.
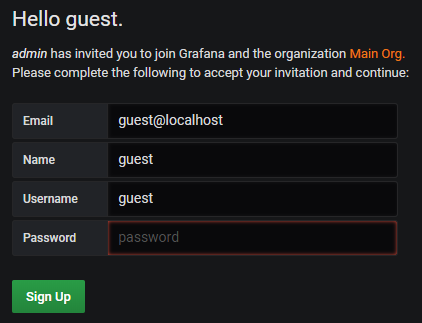
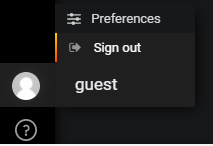
At this point, you will be redirected to the Grafana dashboard under the new login. Sign out, and sign back in as admin.
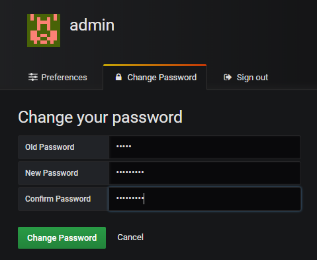
- At this point, change the default admin password.
- Mark the Teamwork Cloud Dashboard as a favorite: