When working with larger models, turn on the Memory Monitor to monitor memory used by a modeling tool. The Memory Monitor shows currently used memory and the current Java heap size. Typically, when you start working with a model, used memory increases because actions are stored in the undo list, and opened diagrams are loaded.
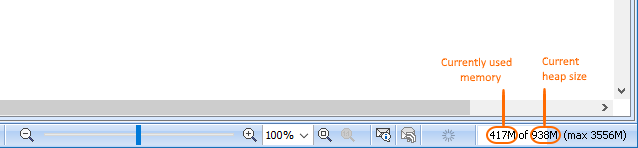
The memory monitor bar showing currently used memory and the current Java heap size.
To turn on the Memory Monitor
- In the main menu of a modeling tool, select View > Status Line > Show Memory Monitor.
The Memory Monitor bar appears in the bottom-right corner of the modeling tool window.
Running out of memory
When used memory takes more than 85% of the total heap size, the Memory Monitor bar turns red, indicating that a modeling tool may run out of memory soon.
If a modeling tool uses all the Java heap size, you can try to recover enough memory for saving a project with the Garbage Collector, but this may take some time.
To free unused memory with the Garbage Collector
Do one of the following:
- Click anywhere on the Memory Monitor bar and select Run Garbage Collector.
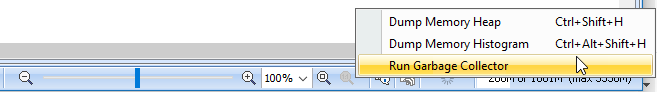
The Memory Monitor pop-up window
If you find it impossible to use the modeling tool and/or see the Out of Memory error, you should dump memory heap to the .hprof file that is created in the defined location on the computer and then submit this file to customer support for further assistance regarding the memory consumption issue.
To dump memory heap
Do one of the following:
- Click anywhere on the Memory Monitor bar, select Dump Memory Heap, and then set the desired name and location of the memory heap file. By default, the name of the file is generated according to the current timestamp.
- Press Ctrl+Shift+H on your keyboard and then define the name and location of the generated memory heap file.
You must create a new file for the heap dump since the memory heap cannot be dumped to an existing file.
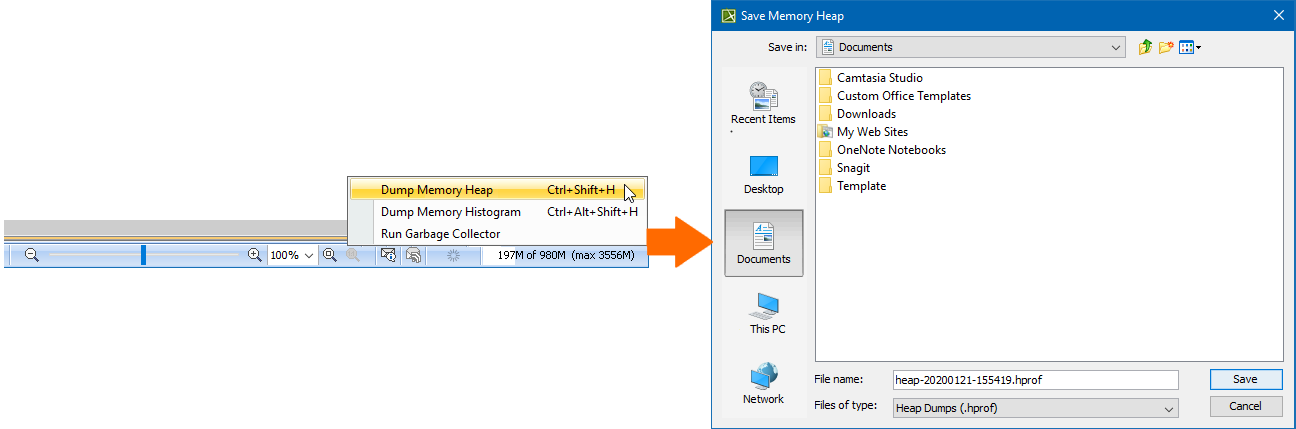
Dumping memory heap
If the Memory Monitor bar is still red, save the model, restart the modeling tool, and reload the model. If the Memory Monitor bar stays red after reloading the model, you should increase the maximum Java heap size.
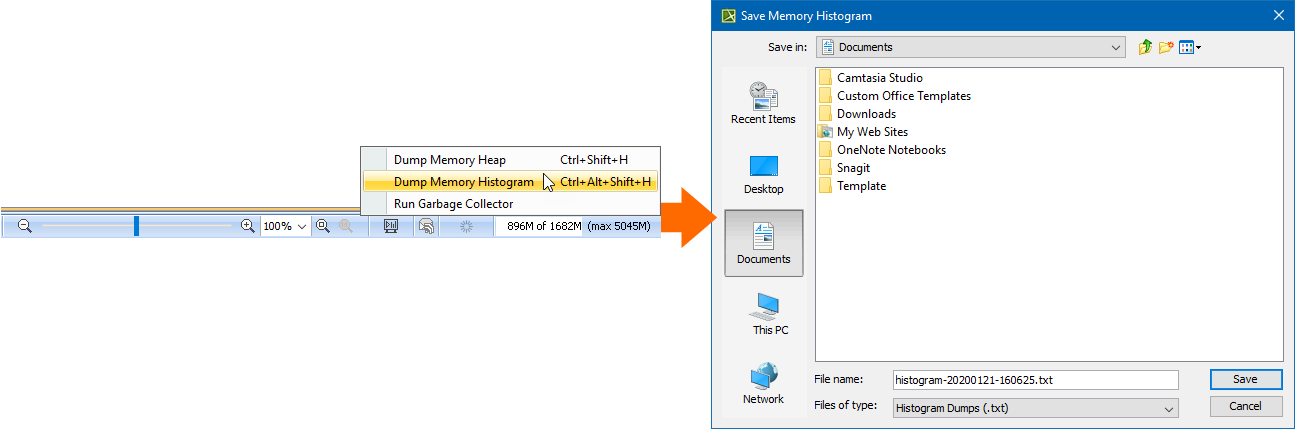
To dump memory histogram
Do one of the following:
- Click anywhere on the Memory Monitor bar, select Dump Memory Histogram, and then set the desired name and location of the memory histogram file. By default, the name of the file is generated according to the current timestamp.
- Press Ctrl+Alt+Shift+H on your keyboard and then define the name and location of the generated memory histogram file.