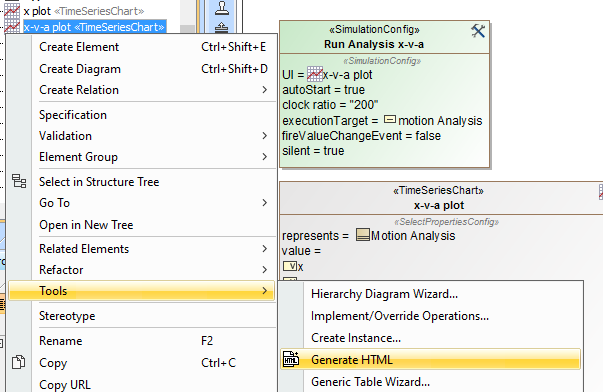
Additionally, you can deploy the Time series chart along with the standard UI modeling diagram on the Web user interface. This web UI capability is enabled by selecting the menu Generate HTML from either the context menu (right-click) of each Time series chart element or the toolbar of the UI diagram.

The Generate HTML context menu of Time series Chart.
The Generate HTML button on the UI diagram toolbar. Once the Generate HTML menu has been selected, the following message: INFO: HTML file(s) is/are generated to <projectName> folder will appear on the Simulation Console pane.
To plot on the web-based UI
- Click
 on the UI diagram toolbar. on the UI diagram toolbar. - Double-click <<SimulationConfig>> to open its Specification window.
- Select the Start Web Server property check box (true) to start the Web Server.
- Run the simulation.
- Click the URL, e.g., http://10.1.1.64:8080/, that appears on the Simulation Console pane when the model simulation is running. The web UI will open in your web browser.
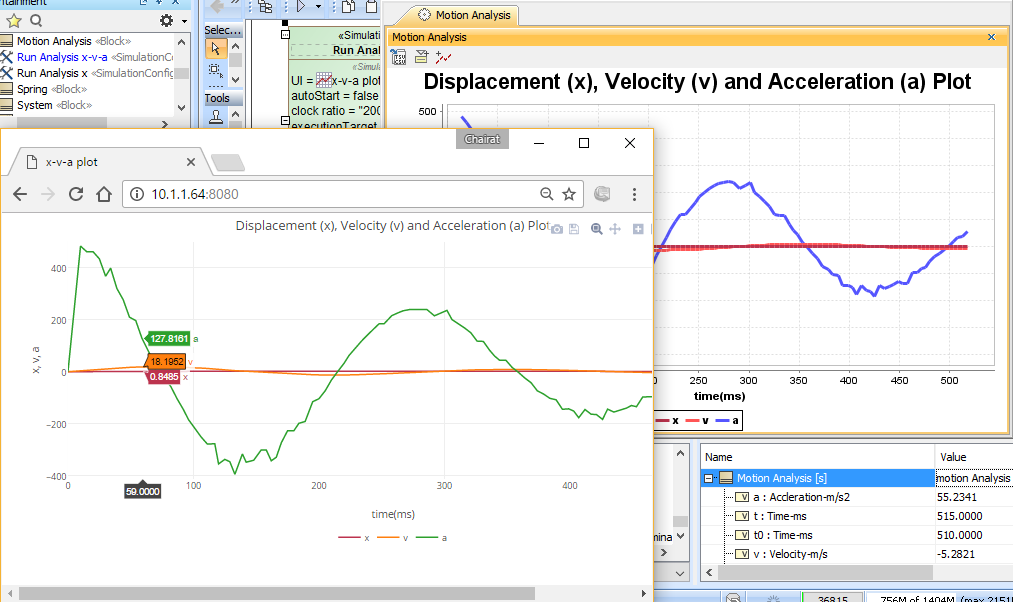
The chart that appears on the web UI is the same chart that represents the values of the simulation UI. If the values on the chart simulation UI change, the corresponding chart will change accordingly. The layout of the Time series chart is auto-aligned with the chart properties of the runtime UI, e.g., Title, fixedRange, gridX, gridY, and plotColor.

The Time series Chart on the Web UI representing the values that correspond to those of the chart in the simulation UI. |