Skip to main content
assistive.skiplink.to.breadcrumbs
assistive.skiplink.to.header.menu
assistive.skiplink.to.action.menu
assistive.skiplink.to.quick.search
Log in
Help / Tips
Help
Online Help
Keyboard Shortcuts
Feed Builder
What’s new
Available Gadgets
About Confluence
Search
Quick Search
Hit enter to search
Cameo Simulation Toolkit 2021x
Content
Pages
Blog
Space Tools
Settings
Content Tools
64953992
CST2021x
3
true
Breadcrumbs
Space Tools
Overview
Content Tools
Browse Pages
Undefined Pages
Attachments
RSS Feeds
Filter By File Extension:
Filter By Label:
Name
Size
Creator
Creation Date
Last Modification Date
Labels
Attached To
PNG File
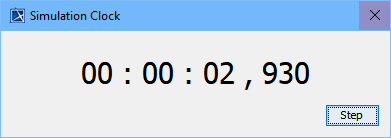
Simulation clock.PNG
4 kB
user-52ec1
Jun 06, 2018 05:41
Jun 06, 2018 05:41
No labels
Page:
Simulation time and simulation clock
PNG File
110117_X_Chart.png
4 kB
user-1438d
Jun 08, 2017 03:19
Jun 08, 2017 03:19
No labels
Page:
Exporting plots data to an instance model
PNG File
resizing_shapes.png
4 kB
Inga A.
Feb 01, 2021 10:01
Feb 01, 2021 10:01
No labels
Page:
Simulation information in diagrams
PNG File
resizing_shapes.png
4 kB
Inga A.
Feb 01, 2021 10:01
Feb 01, 2021 10:01
No labels
Page:
Displaying simulation information
PNG File
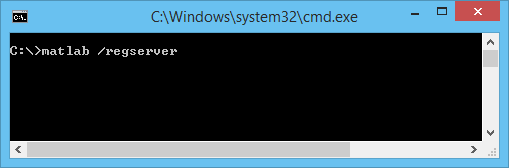
CommandPromptWindow.png
3 kB
user-1438d
Jun 08, 2017 03:19
Jun 08, 2017 03:19
No labels
Page:
Integration with MATLAB
PNG File
ValueExchanger_003.PNG
3 kB
user-1438d
Jun 08, 2017 03:19
Jun 08, 2017 03:19
No labels
Page:
Exporting runtime values to Parametric Evaluator
PNG File
worddav34ec79dfb0b9452bdf513c2af654c933.png
3 kB
user-1438d
Jun 08, 2017 03:20
Jun 08, 2017 03:20
No labels
Page:
Creating resetTime Operation and resetTime Activity
PNG File
ValueExchanger_002.png
3 kB
user-1438d
Jun 08, 2017 03:19
Jun 08, 2017 03:19
No labels
Page:
Exchanging values between slot and mathematical environment
PNG File
worddavf6bb2ee026c1f5da69ac93853fd47cae.png
3 kB
user-1438d
Jun 08, 2017 03:20
Jun 08, 2017 03:20
No labels
Page:
Creating increaseTime Operation and increaseTime Activity
PNG File
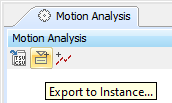
export_button.png
3 kB
user-52ec1
Sept 13, 2017 04:29
Sept 13, 2017 04:29
No labels
Page:
Timeline chart
PNG File
html-table-as-ui-config-f.png
3 kB
user-52ec1
Sept 13, 2017 04:20
Sept 13, 2017 04:20
No labels
Page:
Generating an HTML table from a UI table, Time series chart, and CSV export configuration
PNG File
RunSimulation_button.png
3 kB
user-52ec1
Sept 13, 2017 04:38
Sept 13, 2017 04:38
No labels
Page:
Activity duration simulation
PNG File
worddav43be35b8d4a2413da8149a015837abdb.png
2 kB
user-1438d
Jun 08, 2017 03:20
Jun 08, 2017 03:20
No labels
Page:
Defining the stopwatch Classifier Behavior
PNG File
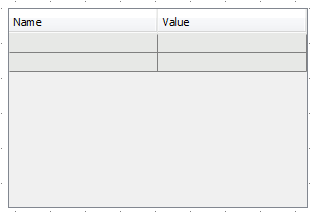
name_value.png
2 kB
user-52ec1
Sept 13, 2017 04:20
Sept 13, 2017 04:20
No labels
Page:
Generating an HTML table from a UI table, Time series chart, and CSV export configuration
PNG File
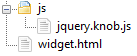
02_folder_structure.png
2 kB
user-52ec1
Jun 09, 2020 03:15
Jun 09, 2020 03:15
No labels
Page:
Integrating widgets for simulation
PNG File
loaddata_button.png
2 kB
user-1438d
Jun 08, 2017 03:19
Jun 08, 2017 03:19
No labels
Page:
Representing data from a CSV file in a line chart
PNG File
filterOpt_button.png
1 kB
user-1438d
Jun 08, 2017 03:19
Jun 08, 2017 03:19
No labels
Page:
Console pane
PNG File
varPaneOptButton.png
1.0 kB
user-1438d
Jun 08, 2017 03:19
Jun 08, 2017 03:19
No labels
Page:
Variables pane
PNG File
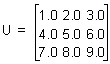
matrixU.png
0.9 kB
user-1438d
Jun 08, 2017 03:19
Jun 08, 2017 03:19
No labels
Page:
Values
PNG File
generateHTML_button.png
0.8 kB
user-1438d
Jun 08, 2017 03:19
Jun 08, 2017 03:19
No labels
Page:
Auto-generating HTML files
Prev
1
…
47
48
49
50
51
52
53
54
55
56
Next
null