On this page
Introduction
You can use modeling tool tables to represent and modify information about the properties of model elements and/or relationships between them. You can create four kinds of tables: Generic Table, Glossary Table, Metric Table, and Instance Table. The different purposes for each table are illustrated below:
Generic Table allows you to manage selected elements and their properties in a single place. The example below is from a generic table.mdzip sample model.
Glossary Table allows you to define specific term(s) and gives you the ability to reuse the term(s) anywhere in your model. The example below is created only for this image and is not saved in any of the sample models.
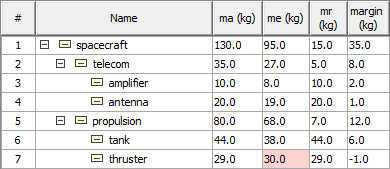
Instance Table allows you to manage an Instance Specification of your model in spreadsheet form. The example is from SpacecraftMassRollup.mdzip sample model.
Metric Table allows you to collect various metrics used to evaluate the current state of your model. The example below is from MagicLibrary requirements.mdzip sample model.
Table areas
Before working with tables, you should understand their structure. All tables contain the following areas:
- Table toolbars allow you to quickly access the options for managing data in the table. Learn more about table toolbars >>
- Criteria area allows you to define the elements that you want to display in the table, specify the scope of the table, and filter necessary information in tables that contain large amounts of data. Learn more about Criteria area >>
- Grid displays data according to the defined criteria area. You can modify the displayed data in the grid by editing cells, removing, hiding, creating new, or selecting other options from the table toolbar. The grid consists of:
- Rows that appear along the side of the table, and are labeled using numbers starting with 1. Each table row represents an element.
- Columns that appear along the top of the table, and are labeled using element property names. Each table column represents element properties.
- Cells are the intersections of every row and column, which represent element property values. - Description area allows you to view the general information regarding the purpose and functions of the table.
- Table info area allows you to view the table display information, such as the number of displayed and total rows.
Basic features of tables
Specific features of tables


