

On this page:
Scripts
The following are the script files used in this page:
The scripted install requires internet access in order to download packages and repository files.
On a single node Teamwork Cloud deployment, you will need to deploy the install_monitoring_node.sh and install_telemetry_node.sh.
On multi-node deployments, you will need to run install_telemetry_node.sh on each Cassandra node, and activate the monitoring of the Teamwork Cloud node by running the add_twc_monitor.sh script on the monitoring node so that Jmxtrans can pull the Teamwork Cloud metrics.
Install the Monitoring Node
Execute the script install_monitoring_node.sh. This script will install InfluxDB, Grafana, and Jmxtrans, configure the firewall to allow traffic from the nodes, configure the InfluxDB databases, configure the first Teamwork Cloud node on Jmxtrans, and configure data sources, as well as users in Grafana.
The script will require the following auxiliary files:
- twcloud.json.template
- influxdb.conf
- datasource1.json
- datasource2.json
- datasource3.json
- datasource4.json
- createguest.json
Install TWC/Cassandra (telemetry) node
Once the monitoring node is deployed, telemetry must be activated for TWC/Cassandra nodes. The install_telemetry_node.sh script will install Telegraf (to send operating system telemetry) as well as deploy the Dropwizard metrics-graphite-3.1.2.jar to push Cassandra metrics to the monitoring node.
The script requires the following auxiliary files:
When monitoring more than one node, in addition to running the install_telemetry_node.sh on the remote node, you will need to run the add_twc_monitor.sh script on the monitoring mode (where Jmxtrans is installed).
Importing the Teamwork Cloud Dashboard into Grafana
- Log in to the Grafana dashboard (http://MONITORINGNODE_IP:3000). Default credentials are admin/admin. Upon logging in, you will be prompted to change the admin password.
- You will be presented with the following screen:
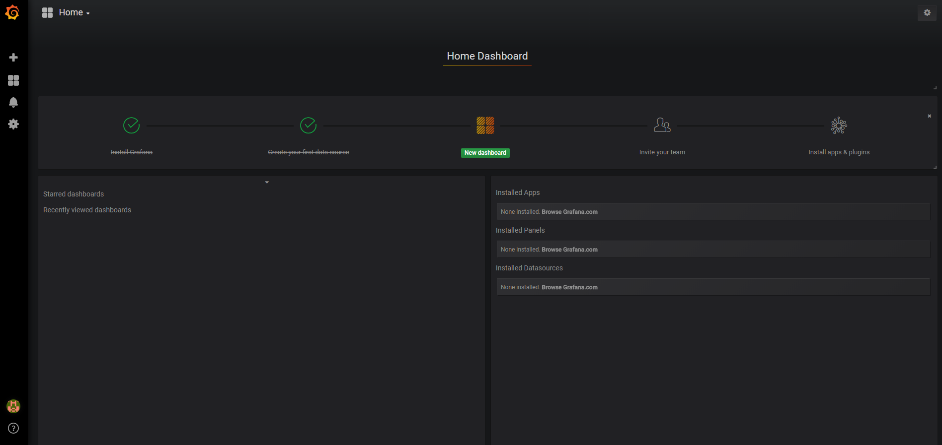
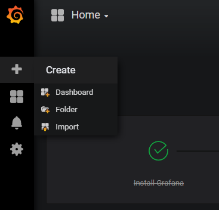
- Select the option to import a dashboard
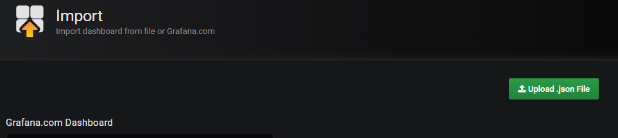
- To upload .json file, click the Upload .json File
- Select the provided Teamwork Cloud Dashboard.json. At this point, you will be presented with the following screen, in which you will need to map the data sources
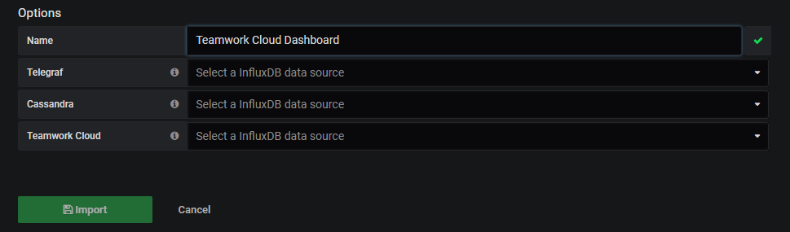
- Select the provided Teamwork Cloud Dashboard.json. At this point, you will be presented with the following screen, in which you will need to map the data sources
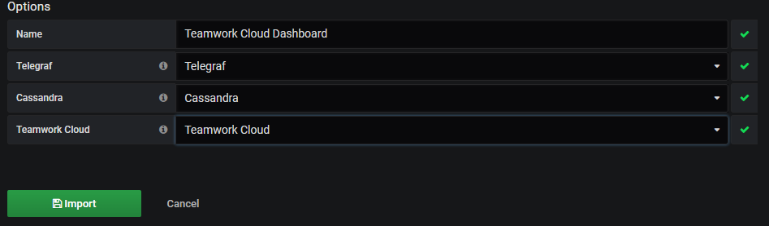
- Map the data sources as shown below and click the Import button
- To make the Teamwork Cloud dashboard your home dashboard, perform the following steps:
- Mark the Teamwork Cloud Dashboard as a favorite

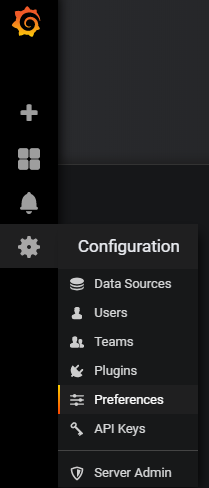
- Select Configuration -> Preferences
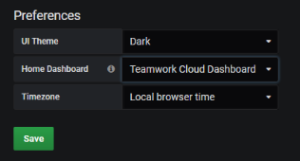
- Select the Teamwork Cloud Dashboard to be your Home Dashboard and click Save.
- Mark the Teamwork Cloud Dashboard as a favorite