The values plotted in a Time series chart are exportable to a CSV file.
To export plots data of a Time series chart to a CSV file
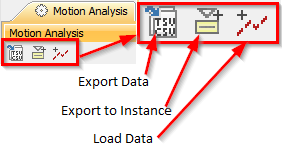
Click the Export Data toolbar button on the Time series chart's plot panel.
- Enter a filename and select a location to save the file.
- Click the Save button.
The following figure shows plotted values in the Time series chart
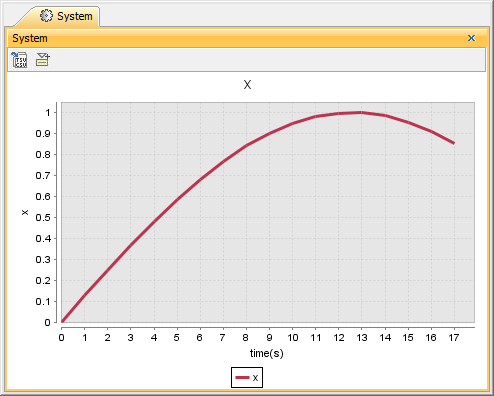
Plotted values in the Time series chart.
The following figure shows the exported plot values in a CSV file
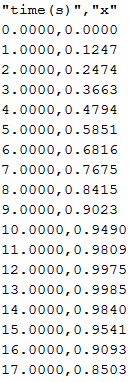
Exported plot values in a CSV file.
If you exported the plotted values in a Time series chart to a CSV file, the exported plots data in the CSV file would look like those shown in the first figure. The axes labels would appear in the first paragraph of the file as the column header.