On this page
Unlike a Time Series chart, a Timeline chart allows you to see the active States of an object or a property during simulation or the Activities simulated in an object. The Timeline plot allows you to see the animation of all active States while a model simulation is running, as well as which objects are active in each State or when a State starts and ends.
Similar to the Time series chart, the Timeline chart also shows the x-axis and y-axis. The x-axis represents time while the y-axis represents object State names in different values. The Timeline chart identifies the changes in the object states and plots them along a timeline. The States are grouped by region. Cameo Simulation Toolkit records changes in the active States and allows you to export them to a CSV or TSV file. You can then import the CSV file into an Excel file to analyze the exported Timeline chart, such as calculating the simulation duration, what object is in a particular State, and how long it was busy or idle.
We use the sample project FlashingLight.mdzip throughout this section to demonstrate how to use the Timeline chart in your model.
Properties of the Timeline chart
The Cameo Simulation Toolkit's Timeline chart can also serve as a predefined subtype of a UI Config. You can use it as a UI mockup of the SimulationConfig element just like an ImageSwitcher. The Specification window of the Timeline chart will be as follows:
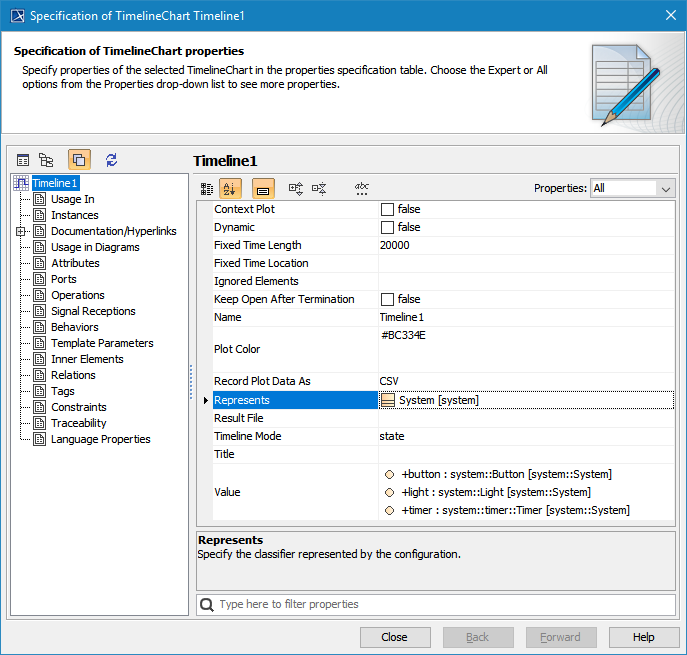
The properties of Timeline chart in the Specification window.
You can change the Timeline chart's display by modifying its properties, as shown in the following table.
| Property | Function |
|---|---|
| Context Plot | To show or hide a context plot. |
| Fixed Time Length | To specify a fixed range of the time axis in a Timeline chart in milliseconds. If you specify a value, the time axis range will be fixed to that particular value. If you do not specify the value of the Fixed Time Location, the plot(s) will move to the left if the time range is greater than the maximum value of the time axis. A fixed time length unit is specified by a time unit tag definition of the Simulation Config. If you do not specify the time unit, Cameo Simulation Toolkit uses 20,000 milliseconds as the default unit. |
| Fixed Time Location | To specify the start time of the time axis in a Timeline chart. If you specify a value for the Fixed Time Length but leave the Fixed Time Location value empty, the Timeline chart will work like an oscilloscope. The plot(s) will move to the left. A fixed time location unit is specified by a time unit tag definition of the Simulation Config. If you do not specify the time unit, Cameo Simulation Toolkit uses the millisecond as the default unit. |
| Ignored Elements | A list of elements (States, Actions, and Activities) which will be ignored and not displayed in the Timeline chart. This list takes priority over the Value list. |
| Plot Color | To specify a plot color. |
| Record Plot Data As | To specify the selected format of the file to be saved if Result File is specified. |
| Result File | To specify the file name to be saved from the results in the selected file format specified in the Record Plot Data As property. Otherwise, the results will be saved into model elements. |
| Timeline Mode | To select whether to show the Timeline of a State or an Activity. |
| Title | To specify the title of a Timeline Chart. |
Using a Timeline chart
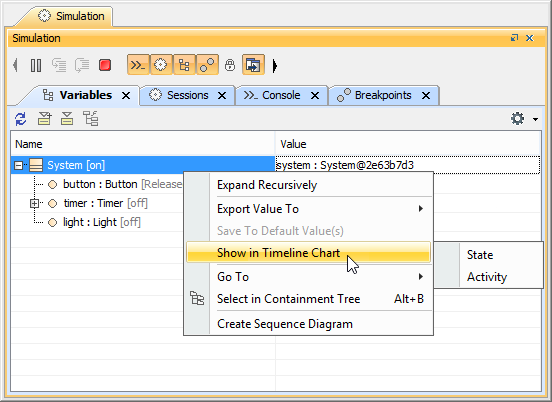
To display a Timeline chart
- Open the shortcut menu of the Variables pane in the Simulation window.
- Right-click the row of a runtime value you want to show on the Timeline chart and select Show in Timeline Chart > State or Activity. This example uses State.
To use a Timeline chart
Create a Timeline chart element to represent a Classifier.
- Open its Specification window and click
 next to the Value property to select the elements/values to be monitored in the Timeline Chart. The Select Nested Properties dialog opens.
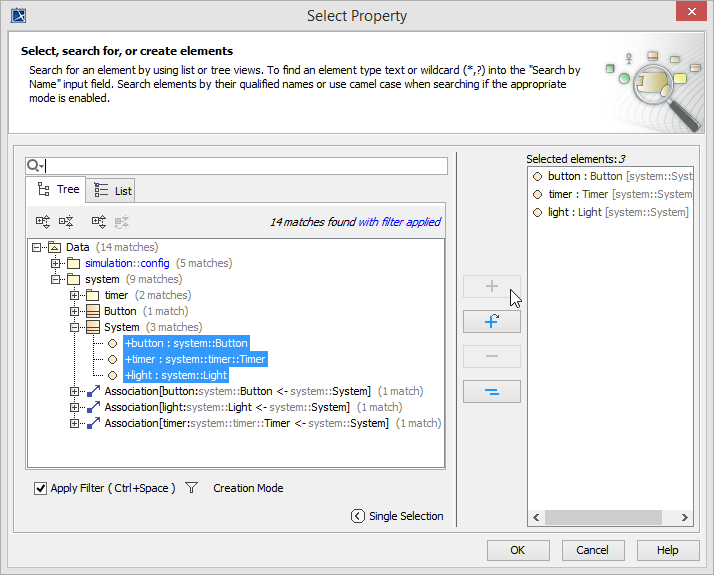
Select the values and click
 . The selected values of the Timeline chart appear in the Value tag property of the Specification window.
- Double-click Simulation Config Flashlight on the diagram pane to open its Specification window.
Click
next to the UI property field. The Select UI dialog opens.Select the Timeline component and click
 to add it to the UI of the Simulation Config.
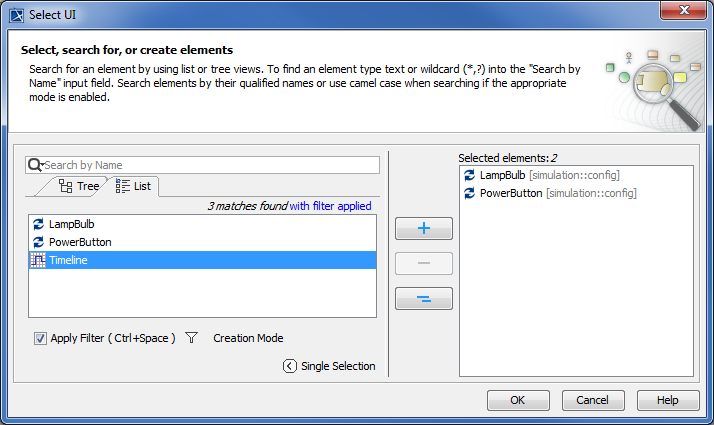
Click
. The added Timeline component appears as one of the Simulation Config UI properties in the Specification window.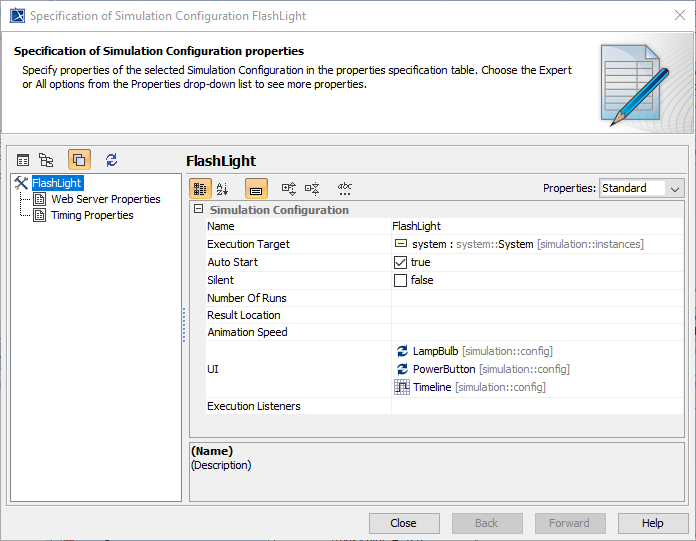
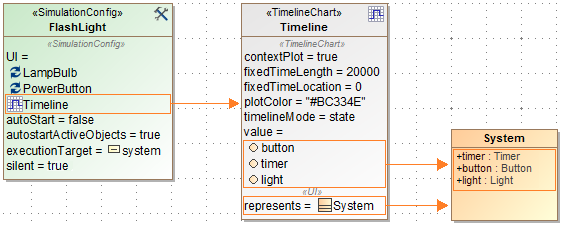
- Once you specify all of the values, the Simulation Config in the diagram pane shows the Timeline chart along with the values that represent systems.
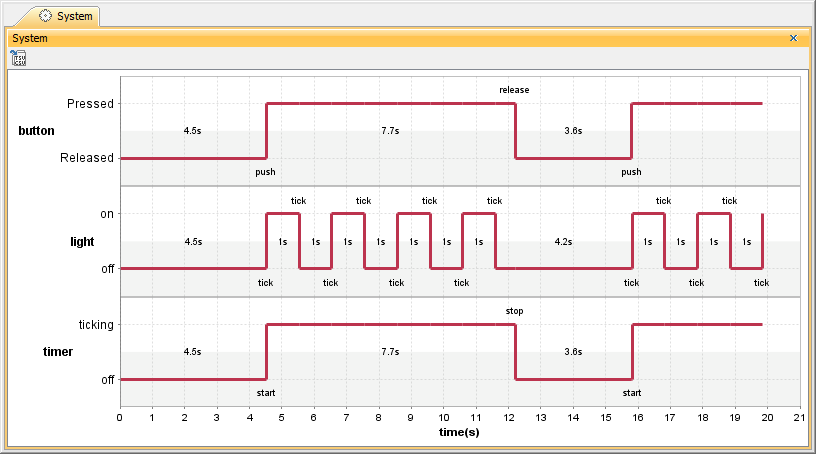
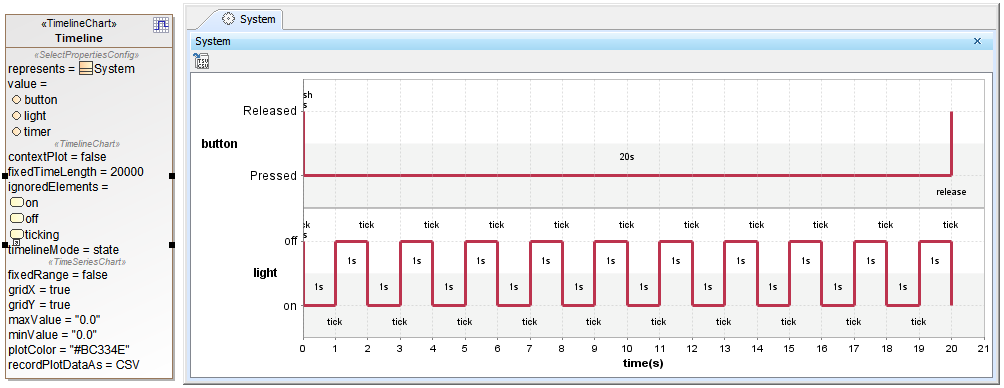
- Run the Timeline Chart. You can see the animation of the active States in the Timeline Chart when the Context Plot option is set to False and True. The following figure shows the Timeline chart output when the Context Plot option in the Specification window is set to False.
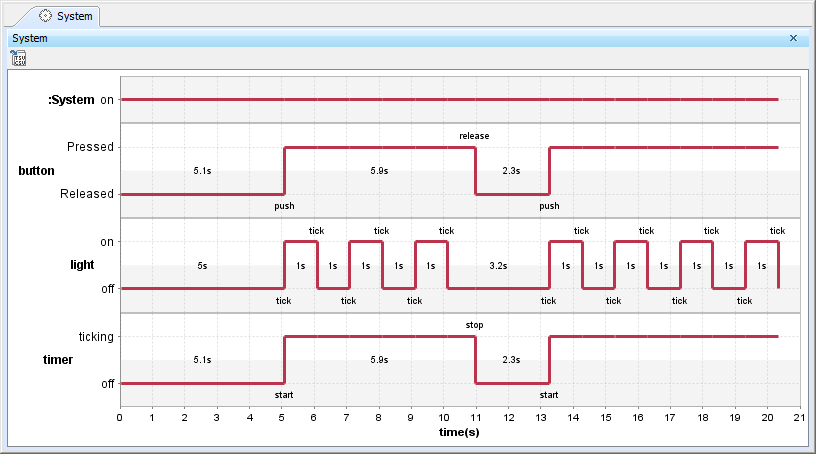
The following figure shows the Timeline chart output when the Context Plot option in the Specification window is set to True
10. Optionally, you can specify in the Ignored Elements property what State will be ignored and not be recorded in the Timeline chart if the user does not want to see them. The following figure shows the Timeline chart output when the Ignored Elements property is set to ignore the ticking State and the off State of timer, and the on State of system
The Ignored Elements property set to ignore the ticking State and the off State of timer, and the on State of system.
Important
A Timeline chart shows only States and Actions which are actually used, e.g., Actions with duration constraints and signaled States. The used elements will be displayed in the chart and sorted in time order.
To show the duration of empty/dummy Actions as duration constraints
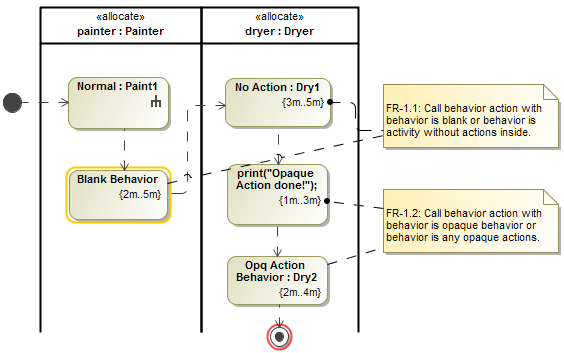
- The Timeline Chart can show empty or dummy actions with duration constraints. The dummy action can be either an empty call Behavior Action with no behavior assigned or an Opaque Action with duration constraints, shown in the following example.
The Timeline Chart shows the Action names on the left-hand side and the duration simulation performed on the Actions (not the Activities) on the right-hand side. The same thing applies to an Action that has Behaviors assigned, but it is empty and has no diagram. The following figure shows the Timeline chart of the empty/dummy actions from the above example.
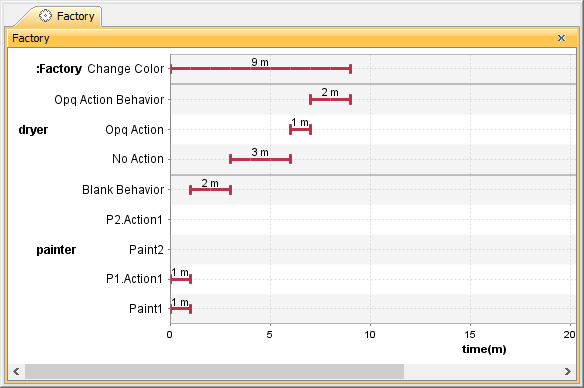
The Timeline chart of the empty/dummy actions.
To export a Timeline chart
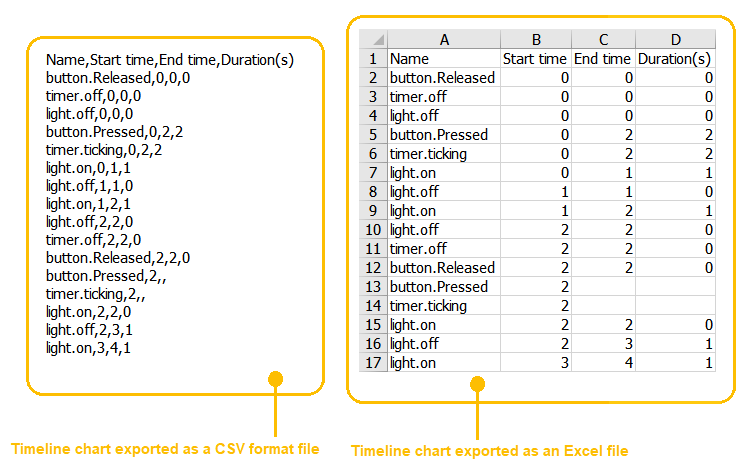
On the Timeline chart pane, e.g., System, click the Export Data button on the Timeline Chart dialog.
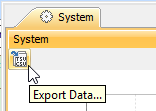
- The Timeline chart will be exported as a CSV format file. The exported Timeline chart in an Excel file is in the figure as follows.
Glossary
- Context plot
A Context plot is a Timeline chart property that enables the plot of the context. It appears on top of the chart as a horizontal line.
- CSV
A CSV is a comma-separated values file that stores tabular data (text and number) in plain text. Each line in the file is a record and each record consists of one or more fields, separated by commas.
- Oscilloscope
A piece of equipment showing oscillations in an electric current as waves on the screen.
- Timeline chart
A Timeline chart is used to describe the Behaviors of both individual Classifiers and Interactions of the Classifiers, focusing attention on the time of events triggering a State change.
- TSV
A TSV is a tab-separated values file that stores data in a tabular structure (e.g. database or spreadsheet data). Each line in the file is a record and each record consists of one or more fields, separated by tabs.
Sample model
The models used in the figures on this page are the FlashingLight and OntologicalBehaviorModeling sample models that come with your modeling tool.
To open the sample, do either of the following
- Download FlashingLight.mdzip or OntologicalBehaviorModeling.mdzip.
- Find it in the modeling tool <modeling tool installation directory>\samples\simulation\.