On this page
Generating an HTML table from a UI table
This feature of the Magic Model Analyst enables you to export MagicDraw HTML tables in UI modeling diagrams to HTML5, allowing them to be viewed in a web browser. The sample model used on this page, SpacecraftMassRollup.mdzip, demonstrates how to create a User Interface table in the User Interface Modeling diagram, generate HTML, run the simulation, and view the UI table in HTML5 in your web browser.
To generate an HTML table from a UI table component
- Open the <modeling_tool_install_dir>\samples\simulation\SpacecraftMassRollup.mdzip file.
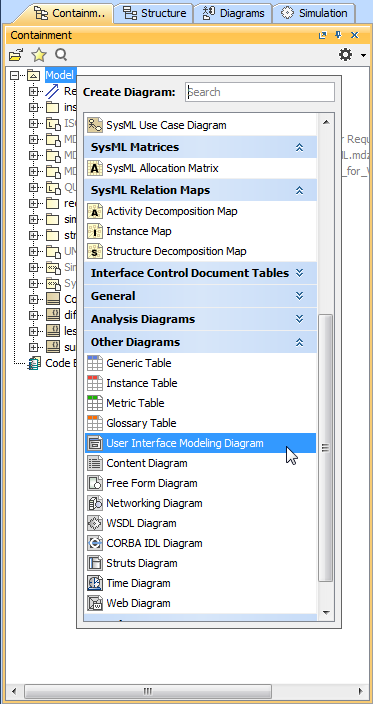
Right-click the Model element in the containment tree. Select Create Diagram > Other Diagrams > User Interface Modeling Diagram.
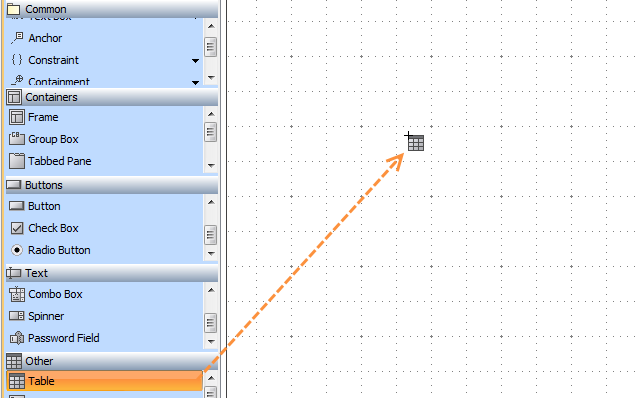
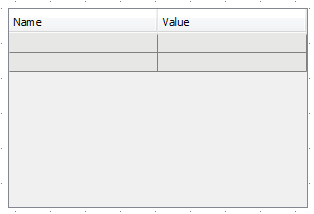
Drag a UI table component onto the newly created diagram.
Drag the spacecraft Block from the Structure Package in the Containment tree to the table.
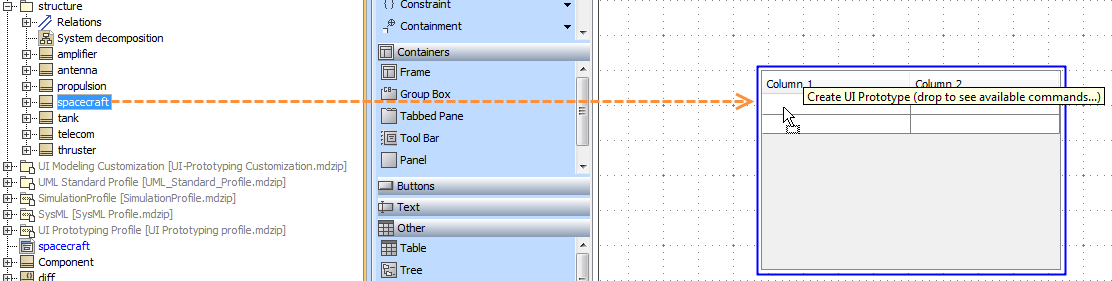
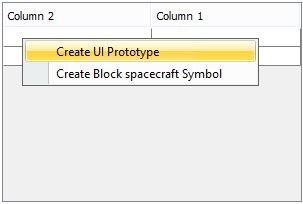
Select Create UI Prototype. The table headers will change from Column 1 and Column 2 to Name and Value.
Tip
If you drag the spacecraft Block to the table quickly, the column name will change automatically, without having to select Create UI Prototype.
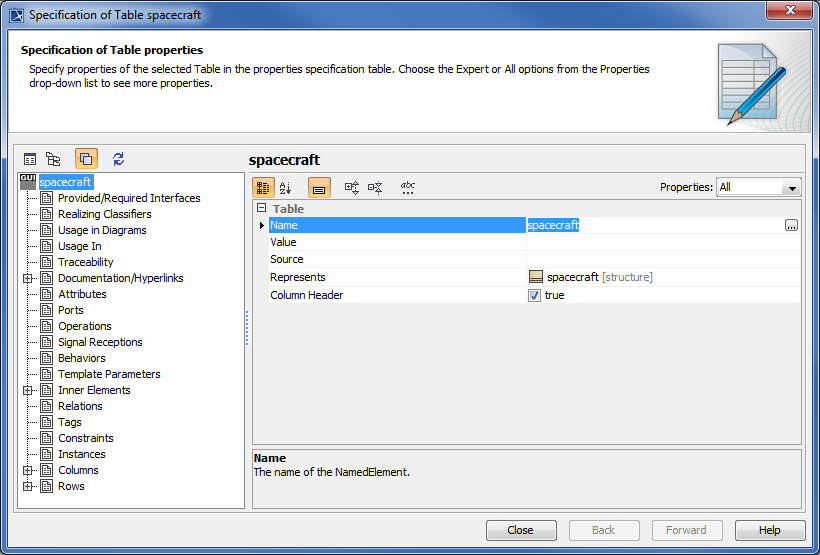
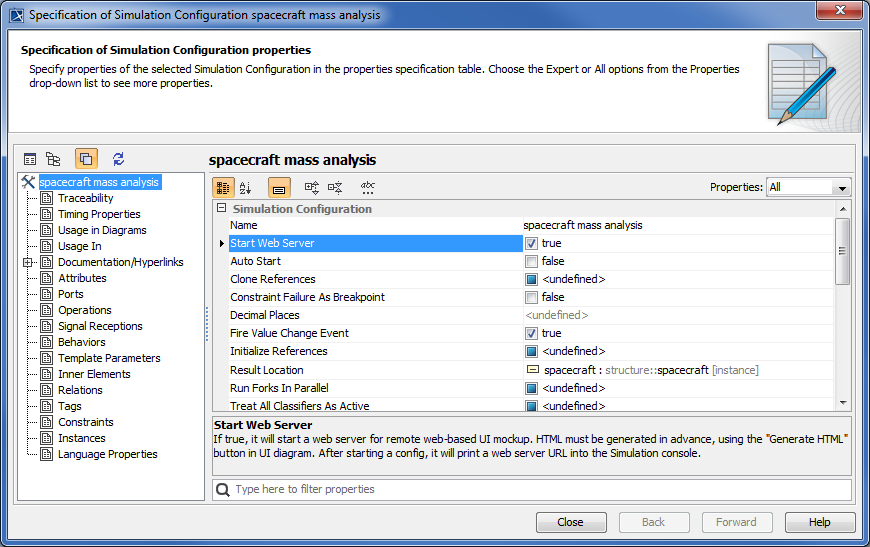
Right-click the UI table. Select Specification to bring up its Specification window as shown below. Note that the Classifier is assigned to the Represents property.
Click
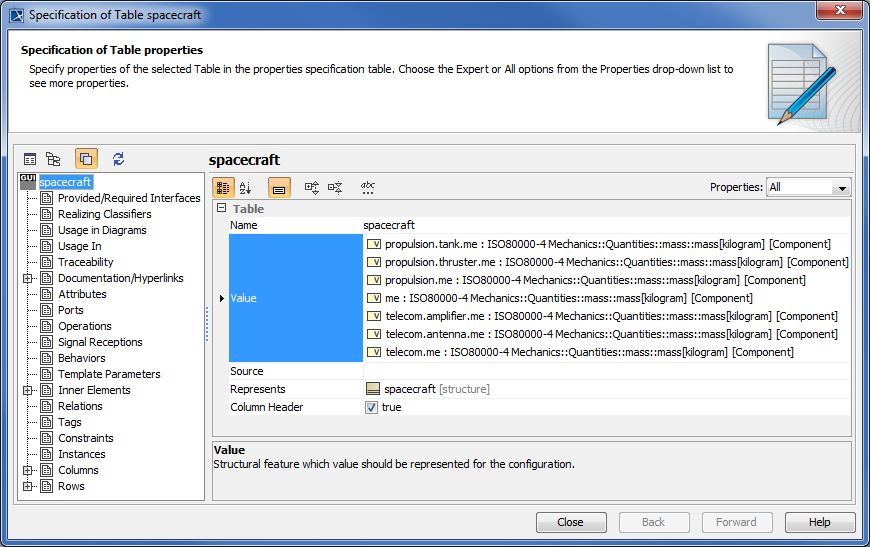
 beside the Value property and select the values you want to monitor from the tree view in the Select Nested Properties dialog.
Click OK. The selected values will appear in the Value property in the UI table Specification window.
- Close the Specification window.
Run the spacecraft mass analysis Simulation Configuration. The Console messages will appear.
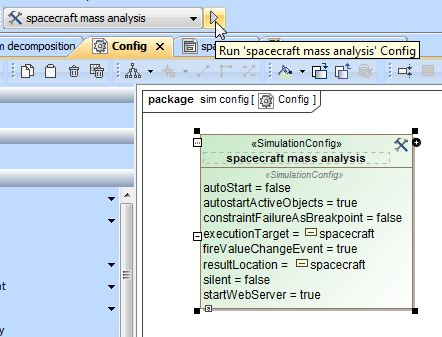
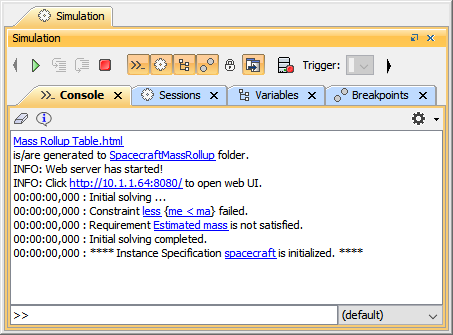
Note that a simulation web server has started. You can open the Specification window of Simulation Configuration to see the Start Web Server (true) option.
Click the HTTP link, e.g., http://10.1.1.64:8080/ in the Console pane to view the simulation in real-time in your browser.
Note
The preferred browser is Google Chrome.
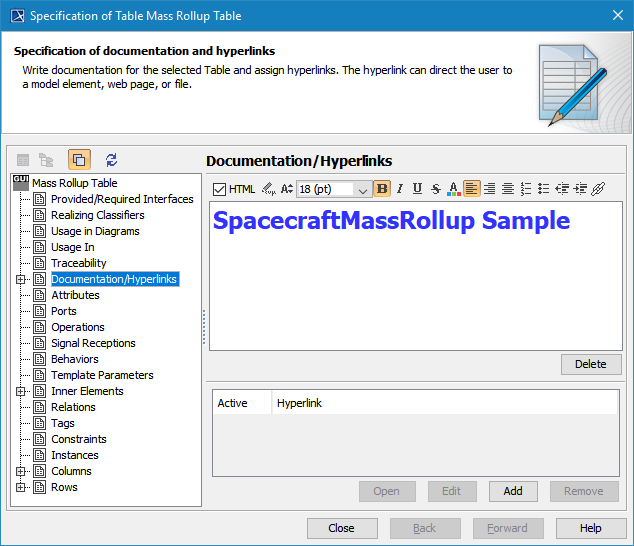
- You can edit the Documentation/Hyperlink tag from the UI table's Specification window and run the simulation again. It will show the table's descriptions.
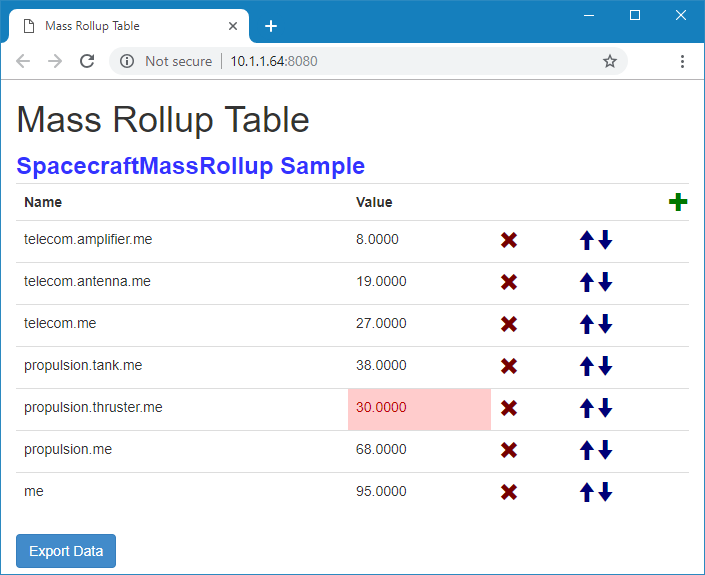
- You can edit the values from the web browser page. The simulation engine will automatically pick the values up and re-calculate. In addition, the verification status of runtime values is supported and shows that there is constraint failure, which is colored in red.
Generating an HTML table from a Time series chart and CSV export configuration
An HTML table can also be generated from a Time series chart and CSV export configuration.
To generate an HTML table from either a Time series chart or a CSV export configuration
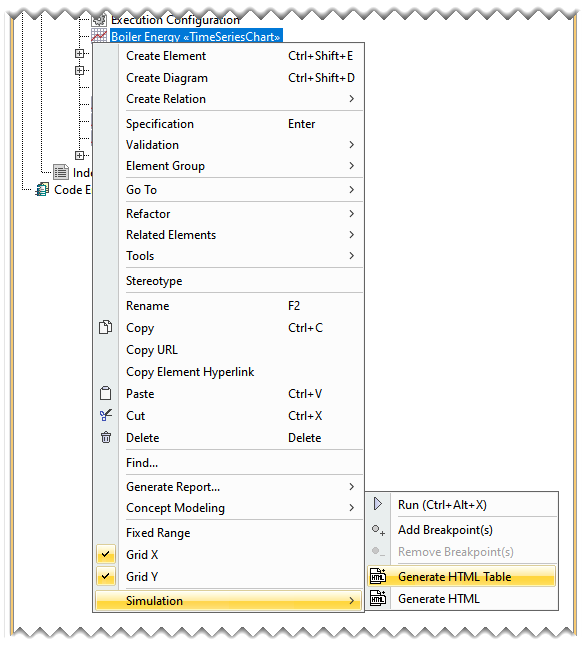
Right-click a Time Series Chart or a CSV Export configuration and choose Simulation> Generate HTML Table.
- This will generate an HTML file, which can be viewed either online or offline. A message stating that the HTML table is generated will be displayed in the Simulation Console pane.
Sample model
The model used in the figures on this page is the SpacecraftMassRollup.mdzip sample model that comes with your modeling tool.
To open the sample
- Find it in the modeling tool <modeling_tool_install_dir>\samples\simulation\SpacecraftMassRollup.mdzip.