- Created by user-66fe9, last updated by Kristina B. on Dec 13, 2021 73 minute read
On this page:
Scripts
The following are the script files used in this page:
The scripted install requires internet access in order to download packages and repository files.
On a single node Teamwork Cloud deployment, you will need to deploy the install_monitoring_node.sh and install_telemetry_node.sh.
On multi-node deployments, you will need to run install_telemetry_node.sh on each Cassandra node, and activate the monitoring of the Teamwork Cloud node by running the add_twc_monitor.sh script on the monitoring node so that Jmxtrans can pull the Teamwork Cloud metrics.
Install the Monitoring Node
Execute the script install_monitoring_node.sh. This script will install InfluxDB, Grafana, and Jmxtrans, configure the firewall to allow traffic from the nodes, configure the InfluxDB databases, configure the first Teamwork Cloud node on Jmxtrans, and configure data sources and users in Grafana.
The script will require the following auxiliary files:
- twcloud.json.template
- infuxdb.conf
- datasource1.json
- datasource2.json
- datasource3.json
- datasource4.json
- createguest.json
#!/bin/bash
echo "=========================================="
echo "Installing Monitoring Node Components     "
echo "=========================================="
HOSTNAME=$(hostname)
FWZONE=$(sudo firewall-cmd --get-default-zone)
echo "Installing InfluxDB"
echo "============================="
sudo yum install -y wget
sudo yum install -y curl
cat <<EOF | sudo tee /etc/yum.repos.d/influxdb.repo
[influxdb]
name = InfluxDB Repository - RHEL \$releasever
baseurl = https://repos.influxdata.com/rhel/\$releasever/\$basearch/stable
enabled = 1
gpgcheck = 1
gpgkey = https://repos.influxdata.com/influxdb.key
EOF
sudo yum -y install influxdb
echo "============================="
echo "Opening firewall for InfluxDB"
echo "============================="
cat <<EOF | sudo tee /etc/firewalld/services/influxdb.xml
<?xml version="1.0" encoding="utf-8"?>
<service version="1.0">
    <short>influxdb</short>
    <description>InfluxDB</description>
    <port port="8086" protocol="tcp"/>
    <port port="2003" protocol="tcp"/>
</service>
EOF
sleep 5
sudo firewall-cmd --permanent --zone=$FWZONE --add-service=influxdb
sudo systemctl enable influxdb.service
echo "============================="
echo "Installing Grafana"
echo "============================="
sudo yum install -y https://s3-us-west-2.amazonaws.com/grafana-releases/release/grafana-5.2.1-1.x86_64.rpm

cat <<EOF | sudo tee /etc/firewalld/services/grafana.xml
<?xml version="1.0" encoding="utf-8"?>
<service version="1.0">
    <short>grafana</short>
    <description>Grafana</description>
    <port port="3000" protocol="tcp"/>
</service>
EOF
sleep 5
echo ""
sudo firewall-cmd --permanent --zone=$FWZONE --add-service=grafana
sudo firewall-cmd --reload
sudo systemctl enable grafana-server.service
echo "============================"
echo "Installing jmxtrans"
echo "============================"
sudo yum -y install  https://repo1.maven.org/maven2/org/jmxtrans/jmxtrans/270/jmxtrans-270.rpm
sudo chkconfig --del jmxtrans
read -e -p "Please enter the hostname of the Teamwork Cloud Node (as obtained via the hostname command):  "  -i ""  HOSTNAME
echo ""
read -e -p "Please enter the IP Address of the Teamwork Cloud Node:  "  -i ""  IPADDRESS
echo ""
JMXFILE=twcloud-$HOSTNAME.json
sudo sed -e "s/HOST_NAME/$HOSTNAME/g" twcloud.json.template > $JMXFILE
sudo sed -i "s/IP_ADDRESS/$IPADDRESS/g" $JMXFILE

sudo chmod 755 $JMXFILE
sudo \cp -fR $JMXFILE /var/lib/jmxtrans/

cat <<EOF | sudo tee /etc/systemd/system/jmxtrans.service
[Unit]
Description=JMX Transformer - more than meets the eye
After=syslog.target network.target

[Service]
Type=forking
User=jmxtrans
Group=jmxtrans
# Run ExecStartPre with root-permissions
PermissionsStartOnly=true
ExecStartPre=-/usr/bin/mkdir /run/jmxtrans/
ExecStartPre=/usr/bin/chown -R jmxtrans:jmxtrans /run/jmxtrans/
PIDFile=/var/run/jmxtrans/jmxtrans.pid
ExecStart=/usr/share/jmxtrans/bin/jmxtrans start

[Install]
WantedBy=multi-user.target


EOF
sleep 5
sudo chmod +x /etc/systemd/system/jmxtrans.service
sudo sed -i '/wrapper.app.parameter.3/a wrapper.app.parameter.4=-s\nwrapper.app.parameter.5=30\n' /etc/jmxtrans/wrapper.conf
sudo systemctl enable jmxtrans
echo "==========================="
echo "Initializing influxdb databases with 35 day retention"
echo "==========================="
sudo cp influxdb.conf /etc/influxdb/influxdb.conf
sudo systemctl daemon-reload
sudo systemctl enable influxdb

sudo systemctl start influxdb
sleep 5
sudo influx -execute "CREATE DATABASE graphite with duration 35d"
sudo influx -execute "CREATE DATABASE telegraf with duration 35d"
sudo influx -execute "CREATE DATABASE twcloud with duration 35d"
sudo influx -execute "CREATE DATABASE webapp with duration 35d"
sudo systemctl daemon-reload
echo "==========================="
echo "Starting Grafana Server"
echo "==========================="
sudo systemctl enable grafana-server
sudo systemctl start grafana-server
echo "==========================="
echo "Starting jmxtrans"
echo "==========================="
sudo systemctl enable jmxtrans
sudo systemctl start jmxtrans
echo "=========================="
echo "Reloading firewall rules"
echo "=========================="
sudo firewall-cmd --reload
echo "=========================="
echo "Create Grafana Datasources"
echo "=========================="
sudo curl -X POST -H "Content-Type: application/json" -d @datasource1.json http://admin:admin@localhost:3000/api/datasources
sudo curl -X POST -H "Content-Type: application/json" -d @datasource2.json http://admin:admin@localhost:3000/api/datasources
sudo curl -X POST -H "Content-Type: application/json" -d @datasource3.json http://admin:admin@localhost:3000/api/datasources
sudo curl -X POST -H "Content-Type: application/json" -d @datasource4.json http://admin:admin@localhost:3000/api/datasources
echo "=========================="
echo "Create Grafana Guest User"
echo "=========================="
sudo curl -X POST -H "Content-Type: application/json" -d @createguest.json http://admin:admin@localhost:3000/api/admin/users/
{
   "servers":[
      {
         "port":"2468",
         "host":"IP_ADDRESS",
         "queries":[
            {
               "obj":"java.lang:type=Memory",
               "attr":[
                  "HeapMemoryUsage",
                  "NonHeapMemoryUsage"
               ],
               "resultAlias":"jvmMemory",
               "outputWriters":[
                  {
                     "@class":"com.googlecode.jmxtrans.model.output.InfluxDbWriterFactory",
                     "url":"http://127.0.0.1:8086/",
                     "username":"admin",
                     "password":"admin",
                     "database":"twcloud",
                     "tags":{
                        "host":"HOST_NAME"
                     }
                  }
               ]
            },
            {
               "obj":"java.lang:type=GarbageCollector,*",
               "attr":[
                  "CollectionCount",
                  "CollectionTime"
               ],
               "resultAlias":"jvmGC",
               "outputWriters":[
                  {
                     "@class":"com.googlecode.jmxtrans.model.output.InfluxDbWriterFactory",
                     "url":"http://127.0.0.1:8086/",
                     "username":"admin",
                     "password":"admin",
                     "database":"twcloud",
                     "tags":{
                        "host":"HOST_NAME"
                     }
                  }
               ]
            },
            {
               "obj":"TWCloud:type=Metrics,item1=Client,*",
               "attr":[
                  "Count",
                  "Value",
                  "50thPercentile",
                  "99thPercentile"
               ],
               "resultAlias":"twc",
               "outputWriters":[
                  {
                     "@class":"com.googlecode.jmxtrans.model.output.InfluxDbWriterFactory",
                     "url":"http://127.0.0.1:8086/",
                     "username":"admin",
                     "password":"admin",
                     "database":"twcloud",
                     "tags":{
                        "host":"HOST_NAME"
                     }
                  }
               ]
            },
            {
               "obj":"TWCloud:type=Metrics,item1=Persistence,*",
               "attr":[
                  "Count",
                  "Value",
                  "50thPercentile",
                  "99thPercentile"
               ],
               "resultAlias":"twc",
               "outputWriters":[
                  {
                     "@class":"com.googlecode.jmxtrans.model.output.InfluxDbWriterFactory",
                     "url":"http://127.0.0.1:8086/",
                     "username":"admin",
                     "password":"admin",
                     "database":"twcloud",
                     "tags":{
                        "host":"HOST_NAME"
                     }
                  }
               ]
            },
            {
               "obj":"TWCloud:type=Metrics,item1=ThreadPools,*",
               "attr":[
                  "Count",
                  "Value",
                  "50thPercentile",
                  "99thPercentile"
               ],
               "resultAlias":"twc",
               "outputWriters":[
                  {
                     "@class":"com.googlecode.jmxtrans.model.output.InfluxDbWriterFactory",
                     "url":"http://127.0.0.1:8086/",
                     "username":"admin",
                     "password":"admin",
                     "database":"twcloud",
                     "tags":{
                        "host":"HOST_NAME"
                     }
                  }
               ]
            },
            {
               "obj":"TWCloud:type=Metrics,item1=Cache,*",
               "attr":[
                  "Value"
               ],
               "resultAlias":"twcCacheInt",
               "outputWriters":[
                  {
                     "@class":"com.googlecode.jmxtrans.model.output.InfluxDbWriterFactory",
                     "url":"http://127.0.0.1:8086/",
                     "username":"admin",
                     "password":"admin",
                     "database":"twcloud",
                     "tags":{
                        "host":"HOST_NAME"
                     }
                  }
               ]
            },
            {
               "obj":"TWCloud:type=Metrics,item1=Cache,item2=*,item3=HitPercent",
               "attr":[
                  "Value"
               ],
               "resultAlias":"twcCacheFloat",
               "outputWriters":[
                  {
                     "@class":"com.googlecode.jmxtrans.model.output.InfluxDbWriterFactory",
                     "url":"http://127.0.0.1:8086/",
                     "username":"admin",
                     "password":"admin",
                     "database":"twcloud",
                     "tags":{
                        "host":"HOST_NAME"
                     }
                  }
               ]
            }
         ]
      }
   ]
}
### Welcome to the InfluxDB configuration file.

# The values in this file override the default values used by the system if
# a config option is not specified. The commented out lines are the configuration
# field and the default value used. Uncommenting a line and changing the value
# will change the value used at runtime when the process is restarted.

# Once every 24 hours InfluxDB will report usage data to usage.influxdata.com
# The data includes a random ID, os, arch, version, the number of series and other
# usage data. No data from user databases is ever transmitted.
# Change this option to true to disable reporting.
reporting-disabled = true

# Bind address to use for the RPC service for backup and restore.
# bind-address = "127.0.0.1:8088"

###
### [meta]
###
### Controls the parameters for the Raft consensus group that stores metadata
### about the InfluxDB cluster.
###

[meta]
  # Where the metadata/raft database is stored
  dir = "/var/lib/influxdb/meta"

  # Automatically create a default retention policy when creating a database.
  # retention-autocreate = true

  # If log messages are printed for the meta service
  # logging-enabled = true

###
### [data]
###
### Controls where the actual shard data for InfluxDB lives and how it is
### flushed from the WAL. "dir" may need to be changed to a suitable place
### for your system, but the WAL settings are an advanced configuration. The
### defaults should work for most systems.
###

[data]
  # The directory where the TSM storage engine stores TSM files.
  dir = "/var/lib/influxdb/data"

  # The directory where the TSM storage engine stores WAL files.
  wal-dir = "/var/lib/influxdb/wal"

  # The amount of time that a write will wait before fsyncing.  A duration
  # greater than 0 can be used to batch up multiple fsync calls.  This is useful for slower
  # disks or when WAL write contention is seen.  A value of 0s fsyncs every write to the WAL.
  # Values in the range of 0-100ms are recommended for non-SSD disks.
  # wal-fsync-delay = "0s"


  # The type of shard index to use for new shards.  The default is an in-memory index that is
  # recreated at startup.  A value of "tsi1" will use a disk based index that supports higher
  # cardinality datasets.
  # index-version = "inmem"

  # Trace logging provides more verbose output around the tsm engine. Turning
  # this on can provide more useful output for debugging tsm engine issues.
  # trace-logging-enabled = false

  # Whether queries should be logged before execution. Very useful for troubleshooting, but will
  # log any sensitive data contained within a query.
   query-log-enabled = false

  # Settings for the TSM engine

  # CacheMaxMemorySize is the maximum size a shard's cache can
  # reach before it starts rejecting writes.
  # Valid size suffixes are k, m, or g (case insensitive, 1024 = 1k).
  # Vaues without a size suffix are in bytes.
  # cache-max-memory-size = "1g"

  # CacheSnapshotMemorySize is the size at which the engine will
  # snapshot the cache and write it to a TSM file, freeing up memory
  # Valid size suffixes are k, m, or g (case insensitive, 1024 = 1k).
  # Values without a size suffix are in bytes.
  # cache-snapshot-memory-size = "25m"

  # CacheSnapshotWriteColdDuration is the length of time at
  # which the engine will snapshot the cache and write it to
  # a new TSM file if the shard hasn't received writes or deletes
  # cache-snapshot-write-cold-duration = "10m"

  # CompactFullWriteColdDuration is the duration at which the engine
  # will compact all TSM files in a shard if it hasn't received a
  # write or delete
  # compact-full-write-cold-duration = "4h"

  # The maximum number of concurrent full and level compactions that can run at one time.  A
  # value of 0 results in 50% of runtime.GOMAXPROCS(0) used at runtime.  Any number greater
  # than 0 limits compactions to that value.  This setting does not apply
  # to cache snapshotting.
  # max-concurrent-compactions = 0

  # The maximum series allowed per database before writes are dropped.  This limit can prevent
  # high cardinality issues at the database level.  This limit can be disabled by setting it to
  # 0.
  # max-series-per-database = 1000000

  # The maximum number of tag values per tag that are allowed before writes are dropped.  This limit
  # can prevent high cardinality tag values from being written to a measurement.  This limit can be
  # disabled by setting it to 0.
  # max-values-per-tag = 100000

###
### [coordinator]
###
### Controls the clustering service configuration.
###

[coordinator]
  # The default time a write request will wait until a "timeout" error is returned to the caller.
  # write-timeout = "10s"

  # The maximum number of concurrent queries allowed to be executing at one time.  If a query is
  # executed and exceeds this limit, an error is returned to the caller.  This limit can be disabled
  # by setting it to 0.
  # max-concurrent-queries = 0

  # The maximum time a query will is allowed to execute before being killed by the system.  This limit
  # can help prevent run away queries.  Setting the value to 0 disables the limit.
  # query-timeout = "0s"

  # The time threshold when a query will be logged as a slow query.  This limit can be set to help
  # discover slow or resource intensive queries.  Setting the value to 0 disables the slow query logging.
  # log-queries-after = "0s"

  # The maximum number of points a SELECT can process.  A value of 0 will make
  # the maximum point count unlimited.  This will only be checked every second so queries will not
  # be aborted immediately when hitting the limit.
  # max-select-point = 0

  # The maximum number of series a SELECT can run.  A value of 0 will make the maximum series
  # count unlimited.
  # max-select-series = 0

  # The maxium number of group by time bucket a SELECT can create.  A value of zero will max the maximum
  # number of buckets unlimited.
  # max-select-buckets = 0

###
### [retention]
###
### Controls the enforcement of retention policies for evicting old data.
###

[retention]
  # Determines whether retention policy enforcement enabled.
  # enabled = true

  # The interval of time when retention policy enforcement checks run.
  # check-interval = "30m"

###
### [shard-precreation]
###
### Controls the precreation of shards, so they are available before data arrives.
### Only shards that, after creation, will have both a start- and end-time in the
### future, will ever be created. Shards are never precreated that would be wholly
### or partially in the past.

[shard-precreation]
  # Determines whether shard pre-creation service is enabled.
  # enabled = true

  # The interval of time when the check to pre-create new shards runs.
  # check-interval = "10m"

  # The default period ahead of the endtime of a shard group that its successor
  # group is created.
  # advance-period = "30m"

###
### Controls the system self-monitoring, statistics and diagnostics.
###
### The internal database for monitoring data is created automatically if
### if it does not already exist. The target retention within this database
### is called 'monitor' and is also created with a retention period of 7 days
### and a replication factor of 1, if it does not exist. In all cases the
### this retention policy is configured as the default for the database.

[monitor]
  # Whether to record statistics internally.
  # store-enabled = true

  # The destination database for recorded statistics
  # store-database = "_internal"

  # The interval at which to record statistics
  # store-interval = "10s"

###
### [http]
###
### Controls how the HTTP endpoints are configured. These are the primary
### mechanism for getting data into and out of InfluxDB.
###

[http]
  # Determines whether HTTP endpoint is enabled.
  # enabled = true

  # The bind address used by the HTTP service.
  # bind-address = ":8086"

  # Determines whether user authentication is enabled over HTTP/HTTPS.
  # auth-enabled = false

  # The default realm sent back when issuing a basic auth challenge.
  # realm = "InfluxDB"

  # Determines whether HTTP request logging is enabled.
   log-enabled = false

  # Determines whether detailed write logging is enabled.
  # write-tracing = false

  # Determines whether the pprof endpoint is enabled.  This endpoint is used for
  # troubleshooting and monitoring.
  # pprof-enabled = true

  # Determines whether HTTPS is enabled.
  # https-enabled = false

  # The SSL certificate to use when HTTPS is enabled.
  # https-certificate = "/etc/ssl/influxdb.pem"

  # Use a separate private key location.
  # https-private-key = ""

  # The JWT auth shared secret to validate requests using JSON web tokens.
  # shared-secret = ""

  # The default chunk size for result sets that should be chunked.
  # max-row-limit = 0

  # The maximum number of HTTP connections that may be open at once.  New connections that
  # would exceed this limit are dropped.  Setting this value to 0 disables the limit.
  # max-connection-limit = 0

  # Enable http service over unix domain socket
  # unix-socket-enabled = false

  # The path of the unix domain socket.
  # bind-socket = "/var/run/influxdb.sock"

  # The maximum size of a client request body, in bytes. Setting this value to 0 disables the limit.
  # max-body-size = 25000000


###
### [ifql]
###
### Configures the ifql RPC API.
###

[ifql]
  # Determines whether the RPC service is enabled.
  # enabled = true

  # Determines whether additional logging is enabled.
   log-enabled = false

  # The bind address used by the ifql RPC service.
  # bind-address = ":8082"


###
### [subscriber]
###
### Controls the subscriptions, which can be used to fork a copy of all data
### received by the InfluxDB host.
###

[subscriber]
  # Determines whether the subscriber service is enabled.
  # enabled = true

  # The default timeout for HTTP writes to subscribers.
  # http-timeout = "30s"

  # Allows insecure HTTPS connections to subscribers.  This is useful when testing with self-
  # signed certificates.
  # insecure-skip-verify = false

  # The path to the PEM encoded CA certs file. If the empty string, the default system certs will be used
  # ca-certs = ""

  # The number of writer goroutines processing the write channel.
  # write-concurrency = 40

  # The number of in-flight writes buffered in the write channel.
  # write-buffer-size = 1000


###
### [[graphite]]
###
### Controls one or many listeners for Graphite data.
###

[[graphite]]
  # Determines whether the graphite endpoint is enabled.
   enabled = true
   database = "graphite"
   retention-policy = ""
   bind-address = ":2003"
   protocol = "tcp"
  # consistency-level = "one"

  # These next lines control how batching works. You should have this enabled
  # otherwise you could get dropped metrics or poor performance. Batching
  # will buffer points in memory if you have many coming in.

  # Flush if this many points get buffered
  # batch-size = 5000

  # number of batches that may be pending in memory
  # batch-pending = 10

  # Flush at least this often even if we haven't hit buffer limit
  # batch-timeout = "1s"

  # UDP Read buffer size, 0 means OS default. UDP listener will fail if set above OS max.
  # udp-read-buffer = 0

  ### This string joins multiple matching 'measurement' values providing more control over the final measurement name.
  # separator = "."

  ### Default tags that will be added to all metrics.  These can be overridden at the template level
  ### or by tags extracted from metric
  # tags = ["region=us-east", "zone=1c"]

  ### Each template line requires a template pattern.  It can have an optional
  ### filter before the template and separated by spaces.  It can also have optional extra
  ### tags following the template.  Multiple tags should be separated by commas and no spaces
  ### similar to the line protocol format.  There can be only one default template.
  # templates = [
  #   "*.app env.service.resource.measurement",
  #   # Default template
  #   "server.*",
  # ]

  templates = [
      "*.org.apache.* host.measurement*" ,
      "*.*.org.apache.* host.host.measurement*" ,
      "*.*.*.org.apache.* host.host.host.measurement*" ,
      "*.*.*.*.org.apache.* host.host.host.host.measurement*" ,
      "*.jvm.*  host.measurement*",
      "*.*.jvm.*  host.host.measurement*",
      "*.*.*.jvm.*  host.host.host.measurement*",
      "*.*.*.*.jvm.*  host.host.host.host.measurement*",
	]


###
### [collectd]
###
### Controls one or many listeners for collectd data.
###

[[collectd]]
  # enabled = false
  # bind-address = ":25826"
  # database = "collectd"
  # retention-policy = ""
  #
  # The collectd service supports either scanning a directory for multiple types
  # db files, or specifying a single db file.
  # typesdb = "/usr/local/share/collectd"
  #
  # security-level = "none"
  # auth-file = "/etc/collectd/auth_file"

  # These next lines control how batching works. You should have this enabled
  # otherwise you could get dropped metrics or poor performance. Batching
  # will buffer points in memory if you have many coming in.

  # Flush if this many points get buffered
  # batch-size = 5000

  # Number of batches that may be pending in memory
  # batch-pending = 10

  # Flush at least this often even if we haven't hit buffer limit
  # batch-timeout = "10s"

  # UDP Read buffer size, 0 means OS default. UDP listener will fail if set above OS max.
  # read-buffer = 0

  # Multi-value plugins can be handled two ways.
  # "split" will parse and store the multi-value plugin data into separate measurements
  # "join" will parse and store the multi-value plugin as a single multi-value measurement.
  # "split" is the default behavior for backward compatability with previous versions of influxdb.
  # parse-multivalue-plugin = "split"
###
### [opentsdb]
###
### Controls one or many listeners for OpenTSDB data.
###

[[opentsdb]]
  # enabled = false
  # bind-address = ":4242"
  # database = "opentsdb"
  # retention-policy = ""
  # consistency-level = "one"
  # tls-enabled = false
  # certificate= "/etc/ssl/influxdb.pem"

  # Log an error for every malformed point.
  # log-point-errors = true

  # These next lines control how batching works. You should have this enabled
  # otherwise you could get dropped metrics or poor performance. Only points
  # metrics received over the telnet protocol undergo batching.

  # Flush if this many points get buffered
  # batch-size = 1000

  # Number of batches that may be pending in memory
  # batch-pending = 5

  # Flush at least this often even if we haven't hit buffer limit
  # batch-timeout = "1s"

###
### [[udp]]
###
### Controls the listeners for InfluxDB line protocol data via UDP.
###

[[udp]]
  # enabled = false
  # bind-address = ":8089"
  # database = "udp"
  # retention-policy = ""

  # These next lines control how batching works. You should have this enabled
  # otherwise you could get dropped metrics or poor performance. Batching
  # will buffer points in memory if you have many coming in.

  # Flush if this many points get buffered
  # batch-size = 5000

  # Number of batches that may be pending in memory
  # batch-pending = 10

  # Will flush at least this often even if we haven't hit buffer limit
  # batch-timeout = "1s"

  # UDP Read buffer size, 0 means OS default. UDP listener will fail if set above OS max.
  # read-buffer = 0

###
### [continuous_queries]
###
### Controls how continuous queries are run within InfluxDB.
###

[continuous_queries]
  # Determines whether the continuous query service is enabled.
  # enabled = true

  # Controls whether queries are logged when executed by the CQ service.
   log-enabled = false

  # Controls whether queries are logged to the self-monitoring data store.
  # query-stats-enabled = false

  # interval for how often continuous queries will be checked if they need to run
  # run-interval = "1s"
   {

      "name":"Cassandra",
      "type":"influxdb",
      "typeLogoUrl":"public/app/plugins/datasource/influxdb/img/influxdb_logo.svg",
      "access":"proxy",
      "url":"http://localhost:8086",
      "password":"",
      "user":"",
      "database":"graphite",
      "basicAuth":false,
      "isDefault":false,
      "jsonData":{

      }
  }
  {
      "name":"Telegraf",
      "type":"influxdb",
      "typeLogoUrl":"public/app/plugins/datasource/influxdb/img/influxdb_logo.svg",
      "access":"proxy",
      "url":"http://localhost:8086",
      "password":"",
      "user":"",
      "database":"telegraf",
      "basicAuth":false,
      "isDefault":false,
      "jsonData":{

      }
  }
   {
      "name":"Teamwork Cloud",
      "type":"influxdb",
      "typeLogoUrl":"public/app/plugins/datasource/influxdb/img/influxdb_logo.svg",
      "access":"proxy",
      "url":"http://localhost:8086",
      "password":"",
      "user":"",
      "database":"twcloud",
      "basicAuth":false,
      "isDefault":false,
      "jsonData":{

      }
   }
   {
      "name":"Webapp",
      "type":"influxdb",
      "typeLogoUrl":"public/app/plugins/datasource/influxdb/img/influxdb_logo.svg",
      "access":"proxy",
      "url":"http://localhost:8086",
      "password":"",
      "user":"",
      "database":"webapp",
      "basicAuth":false,
      "isDefault":false,
      "jsonData":{

      }
   }
{
  "name":"guest",
  "email":"guest2@localhost",
  "login":"guest",
  "password":"guest"
}
Install TWC/Cassandra (telemetry) node
Once the monitoring node is deployed, telemetry must be activated for TWC/Cassandra nodes. The install_telemetry_node.sh script will install Telegraf (to send operating system telemetry) as well as deploy the Dropwizard metrics-graphite-3.1.2.jar to push Cassandra metrics to the monitoring node.
The script requires the following auxiliary files:
When monitoring more than one node, in addition to running the install_telemetry_node.sh on the remote node, you will need to run the add_twc_monitor.sh script on the monitoring mode (where jmxtrans is installed).
#!/bin/bash
HOSTNAME=$(hostname)
IP=$(ip route get 1 | awk '{print $NF;exit}')
echo "=========================================="
echo "Installing Cassandra/Teamwork Cloud Monitoring Stack"
echo "=========================================="
echo ""
read -e -p "Please enter the IP address of the server where InfuxDB will be installed :  "  -i ""  IP
echo ""
echo "============================="
echo "Installing telegraf"
echo "============================="
cat <<EOF | sudo tee /etc/yum.repos.d/influxdb.repo
[influxdb]
name = InfluxDB Repository - RHEL \$releasever
baseurl = https://repos.influxdata.com/rhel/\$releasever/\$basearch/stable
enabled = 1
gpgcheck = 1
gpgkey = https://repos.influxdata.com/influxdb.key
EOF
sudo yum -y install telegraf
sudo sed -e "s/HOST_NAME/$IP/g" telegraf.conf.template > telegraf.conf
sudo \cp -fR telegraf.conf /etc/telegraf/telegraf.conf
echo "============================="
echo "Download and deploy metrics-graphite-3.1.2 for Cassandra monitoring"
echo "============================="
sudo wget http://central.maven.org/maven2/io/dropwizard/metrics/metrics-graphite/3.1.2/metrics-graphite-3.1.2.jar
sudo \cp -fR metrics-graphite-3.1.2.jar /usr/share/cassandra/lib/
sudo \cp -fR /etc/cassandra/default.conf/cassandra-env.sh /etc/cassandra/default.conf/cassandra-env.sh.backup
sudo cat <<EOF >> /etc/cassandra/default.conf/cassandra-env.sh

# Enable metrics reporting to InfluxDB using the yammer library
METRICS_REPORTER_CFG="metrics-reporter-graphite.yaml"
JVM_OPTS="\$JVM_OPTS -Dcassandra.metricsReporterConfigFile=\$METRICS_REPORTER_CFG"

EOF
sudo sed -e "s/HOST_NAME/$(hostname)/g" metrics-reporter-graphite.yaml.template > metrics-reporter-graphite.yaml
sudo sed -i "s/IP/$IP/g" metrics-reporter-graphite.yaml
sudo \cp -fR metrics-reporter-graphite.yaml /etc/cassandra/default.conf/metrics-reporter-graphite.yaml
sudo chmod 755 /etc/cassandra/default.conf/metrics-reporter-graphite.yaml
sudo yum -y install net-tools
echo "=============================="
echo "Starting Telegraf Service"
echo "=============================="
sudo systemctl start telegraf
echo "=============================="
echo "Cassandra must be restarted for telemetry to be sent to the monitoring node"
echo "=============================="
# Telegraf Configuration
#
# Telegraf is entirely plugin driven. All metrics are gathered from the
# declared inputs, and sent to the declared outputs.
#
# Plugins must be declared in here to be active.
# To deactivate a plugin, comment out the name and any variables.
#
# Use 'telegraf -config telegraf.conf -test' to see what metrics a config
# file would generate.
#
# Environment variables can be used anywhere in this config file, simply prepend
# them with $. For strings the variable must be within quotes (ie, "$STR_VAR"),
# for numbers and booleans they should be plain (ie, $INT_VAR, $BOOL_VAR)
# Global tags can be specified here in key="value" format.
[global_tags]
# dc = "us-east-1" # will tag all metrics with dc=us-east-1
# rack = "1a"
## Environment variables can be used as tags, and throughout the config file
# user = "$USER"
# Configuration for telegraf agent
[agent]
## Default data collection interval for all inputs
interval = "10s"
## Rounds collection interval to 'interval'
## ie, if interval="10s" then always collect on :00, :10, :20, etc.
round_interval = true
## Telegraf will send metrics to outputs in batches of at most
## metric_batch_size metrics.
## This controls the size of writes that Telegraf sends to output plugins.
metric_batch_size = 1000
## For failed writes, telegraf will cache metric_buffer_limit metrics for each
## output, and will flush this buffer on a successful write. Oldest metrics
## are dropped first when this buffer fills.
## This buffer only fills when writes fail to output plugin(s).
metric_buffer_limit = 10000
## Collection jitter is used to jitter the collection by a random amount.
## Each plugin will sleep for a random time within jitter before collecting.
## This can be used to avoid many plugins querying things like sysfs at the
## same time, which can have a measurable effect on the system.
collection_jitter = "0s"
## Default flushing interval for all outputs. You shouldn't set this below
## interval. Maximum flush_interval will be flush_interval + flush_jitter
flush_interval = "10s"
## Jitter the flush interval by a random amount. This is primarily to avoid
## large write spikes for users running a large number of telegraf instances.
## ie, a jitter of 5s and interval 10s means flushes will happen every 10-15s
flush_jitter = "0s"
## By default or when set to "0s", precision will be set to the same
## timestamp order as the collection interval, with the maximum being 1s.
## ie, when interval = "10s", precision will be "1s"
## when interval = "250ms", precision will be "1ms"
## Precision will NOT be used for service inputs. It is up to each individual
## service input to set the timestamp at the appropriate precision.
## Valid time units are "ns", "us" (or "µs"), "ms", "s".
precision = ""
## Logging configuration:
## Run telegraf with debug log messages.
debug = false
## Run telegraf in quiet mode (error log messages only).
quiet = false
## Specify the log file name. The empty string means to log to stderr.
logfile = ""
## Override default hostname, if empty use os.Hostname()
hostname = ""
## If set to true, do no set the "host" tag in the telegraf agent.
omit_hostname = false
###############################################################################
# OUTPUT PLUGINS #
###############################################################################
# Configuration for influxdb server to send metrics to
[[outputs.influxdb]]
## The HTTP or UDP URL for your InfluxDB instance. Each item should be
## of the form:
## scheme "://" host [ ":" port]
##
## Multiple urls can be specified as part of the same cluster,
## this means that only ONE of the urls will be written to each interval.
# urls = ["udp://localhost:8089"] # UDP endpoint example
urls = ["http://HOST_NAME:8086"] # required
## The target database for metrics (telegraf will create it if not exists).
database = "telegraf" # required
## Name of existing retention policy to write to. Empty string writes to
## the default retention policy.
retention_policy = ""
## Write consistency (clusters only), can be: "any", "one", "quorum", "all"
write_consistency = "any"
## Write timeout (for the InfluxDB client), formatted as a string.
## If not provided, will default to 5s. 0s means no timeout (not recommended).
timeout = "5s"
# username = "telegraf"
# password = "metricsmetricsmetricsmetrics"
## Set the user agent for HTTP POSTs (can be useful for log differentiation)
# user_agent = "telegraf"
## Set UDP payload size, defaults to InfluxDB UDP Client default (512 bytes)
# udp_payload = 512
## Optional SSL Config
# ssl_ca = "/etc/telegraf/ca.pem"
# ssl_cert = "/etc/telegraf/cert.pem"
# ssl_key = "/etc/telegraf/key.pem"
## Use SSL but skip chain & host verification
# insecure_skip_verify = false
## HTTP Proxy Config
# http_proxy = "http://corporate.proxy:3128"
## Compress each HTTP request payload using GZIP.
# content_encoding = "gzip"
# # Configuration for Amon Server to send metrics to.
# [[outputs.amon]]
# ## Amon Server Key
# server_key = "my-server-key" # required.
#
# ## Amon Instance URL
# amon_instance = "https://youramoninstance" # required
#
# ## Connection timeout.
# # timeout = "5s"
# # Configuration for the AMQP server to send metrics to
# [[outputs.amqp]]
# ## AMQP url
# url = "amqp://localhost:5672/influxdb"
# ## AMQP exchange
# exchange = "telegraf"
# ## Auth method. PLAIN and EXTERNAL are supported
# ## Using EXTERNAL requires enabling the rabbitmq_auth_mechanism_ssl plugin as
# ## described here: https://www.rabbitmq.com/plugins.html
# # auth_method = "PLAIN"
# ## Telegraf tag to use as a routing key
# ## ie, if this tag exists, its value will be used as the routing key
# routing_tag = "host"
#
# ## InfluxDB retention policy
# # retention_policy = "default"
# ## InfluxDB database
# # database = "telegraf"
#
# ## Write timeout, formatted as a string. If not provided, will default
# ## to 5s. 0s means no timeout (not recommended).
# # timeout = "5s"
#
# ## Optional SSL Config
# # ssl_ca = "/etc/telegraf/ca.pem"
# # ssl_cert = "/etc/telegraf/cert.pem"
# # ssl_key = "/etc/telegraf/key.pem"
# ## Use SSL but skip chain & host verification
# # insecure_skip_verify = false
#
# ## Data format to output.
# ## Each data format has its own unique set of configuration options, read
# ## more about them here:
# ## https://github.com/influxdata/telegraf/blob/master/docs/DATA_FORMATS_OUTPUT.md
# data_format = "influx"
# # Configuration for AWS CloudWatch output.
# [[outputs.cloudwatch]]
# ## Amazon REGION
# region = "us-east-1"
#
# ## Amazon Credentials
# ## Credentials are loaded in the following order
# ## 1) Assumed credentials via STS if role_arn is specified
# ## 2) explicit credentials from 'access_key' and 'secret_key'
# ## 3) shared profile from 'profile'
# ## 4) environment variables
# ## 5) shared credentials file
# ## 6) EC2 Instance Profile
# #access_key = ""
# #secret_key = ""
# #token = ""
# #role_arn = ""
# #profile = ""
# #shared_credential_file = ""
#
# ## Namespace for the CloudWatch MetricDatums
# namespace = "InfluxData/Telegraf"
# # Configuration for DataDog API to send metrics to.
# [[outputs.datadog]]
# ## Datadog API key
# apikey = "my-secret-key" # required.
#
# ## Connection timeout.
# # timeout = "5s"
# # Send metrics to nowhere at all
# [[outputs.discard]]
# # no configuration
# # Configuration for Elasticsearch to send metrics to.
# [[outputs.elasticsearch]]
# ## The full HTTP endpoint URL for your Elasticsearch instance
# ## Multiple urls can be specified as part of the same cluster,
# ## this means that only ONE of the urls will be written to each interval.
# urls = [ "http://node1.es.example.com:9200" ] # required.
# ## Elasticsearch client timeout, defaults to "5s" if not set.
# timeout = "5s"
# ## Set to true to ask Elasticsearch a list of all cluster nodes,
# ## thus it is not necessary to list all nodes in the urls config option.
# enable_sniffer = false
# ## Set the interval to check if the Elasticsearch nodes are available
# ## Setting to "0s" will disable the health check (not recommended in production)
# health_check_interval = "10s"
# ## HTTP basic authentication details (eg. when using Shield)
# # username = "telegraf"
# # password = "mypassword"
#
# ## Index Config
# ## The target index for metrics (Elasticsearch will create if it not exists).
# ## You can use the date specifiers below to create indexes per time frame.
# ## The metric timestamp will be used to decide the destination index name
# # %Y - year (2016)
# # %y - last two digits of year (00..99)
# # %m - month (01..12)
# # %d - day of month (e.g., 01)
# # %H - hour (00..23)
# index_name = "telegraf-%Y.%m.%d" # required.
#
# ## Template Config
# ## Set to true if you want telegraf to manage its index template.
# ## If enabled it will create a recommended index template for telegraf indexes
# manage_template = true
# ## The template name used for telegraf indexes
# template_name = "telegraf"
# ## Set to true if you want telegraf to overwrite an existing template
# overwrite_template = false
# # Send telegraf metrics to file(s)
# [[outputs.file]]
# ## Files to write to, "stdout" is a specially handled file.
# files = ["stdout", "/tmp/metrics.out"]
#
# ## Data format to output.
# ## Each data format has its own unique set of configuration options, read
# ## more about them here:
# ## https://github.com/influxdata/telegraf/blob/master/docs/DATA_FORMATS_OUTPUT.md
# data_format = "influx"
# # Configuration for Graphite server to send metrics to
# [[outputs.graphite]]
# ## TCP endpoint for your graphite instance.
# ## If multiple endpoints are configured, output will be load balanced.
# ## Only one of the endpoints will be written to with each iteration.
# servers = ["localhost:2003"]
# ## Prefix metrics name
# prefix = ""
# ## Graphite output template
# ## see https://github.com/influxdata/telegraf/blob/master/docs/DATA_FORMATS_OUTPUT.md
# template = "host.tags.measurement.field"
# ## timeout in seconds for the write connection to graphite
# timeout = 2
#
# ## Optional SSL Config
# # ssl_ca = "/etc/telegraf/ca.pem"
# # ssl_cert = "/etc/telegraf/cert.pem"
# # ssl_key = "/etc/telegraf/key.pem"
# ## Use SSL but skip chain & host verification
# # insecure_skip_verify = false
# # Send telegraf metrics to graylog(s)
# [[outputs.graylog]]
# ## UDP endpoint for your graylog instance.
# servers = ["127.0.0.1:12201", "192.168.1.1:12201"]
# # Configuration for sending metrics to an Instrumental project
# [[outputs.instrumental]]
# ## Project API Token (required)
# api_token = "API Token" # required
# ## Prefix the metrics with a given name
# prefix = ""
# ## Stats output template (Graphite formatting)
# ## see https://github.com/influxdata/telegraf/blob/master/docs/DATA_FORMATS_OUTPUT.md#graphite
# template = "host.tags.measurement.field"
# ## Timeout in seconds to connect
# timeout = "2s"
# ## Display Communcation to Instrumental
# debug = false
# # Configuration for the Kafka server to send metrics to
# [[outputs.kafka]]
# ## URLs of kafka brokers
# brokers = ["localhost:9092"]
# ## Kafka topic for producer messages
# topic = "telegraf"
# ## Telegraf tag to use as a routing key
# ## ie, if this tag exists, its value will be used as the routing key
# routing_tag = "host"
#
# ## CompressionCodec represents the various compression codecs recognized by
# ## Kafka in messages.
# ## 0 : No compression
# ## 1 : Gzip compression
# ## 2 : Snappy compression
# compression_codec = 0
#
# ## RequiredAcks is used in Produce Requests to tell the broker how many
# ## replica acknowledgements it must see before responding
# ## 0 : the producer never waits for an acknowledgement from the broker.
# ## This option provides the lowest latency but the weakest durability
# ## guarantees (some data will be lost when a server fails).
# ## 1 : the producer gets an acknowledgement after the leader replica has
# ## received the data. This option provides better durability as the
# ## client waits until the server acknowledges the request as successful
# ## (only messages that were written to the now-dead leader but not yet
# ## replicated will be lost).
# ## -1: the producer gets an acknowledgement after all in-sync replicas have
# ## received the data. This option provides the best durability, we
# ## guarantee that no messages will be lost as long as at least one in
# ## sync replica remains.
# required_acks = -1
#
# ## The total number of times to retry sending a message
# max_retry = 3
#
# ## Optional SSL Config
# # ssl_ca = "/etc/telegraf/ca.pem"
# # ssl_cert = "/etc/telegraf/cert.pem"
# # ssl_key = "/etc/telegraf/key.pem"
# ## Use SSL but skip chain & host verification
# # insecure_skip_verify = false
#
# ## Optional SASL Config
# # sasl_username = "kafka"
# # sasl_password = "secret"
#
# ## Data format to output.
# ## Each data format has its own unique set of configuration options, read
# ## more about them here:
# ## https://github.com/influxdata/telegraf/blob/master/docs/DATA_FORMATS_OUTPUT.md
# data_format = "influx"
# # Configuration for the AWS Kinesis output.
# [[outputs.kinesis]]
# ## Amazon REGION of kinesis endpoint.
# region = "ap-southeast-2"
#
# ## Amazon Credentials
# ## Credentials are loaded in the following order
# ## 1) Assumed credentials via STS if role_arn is specified
# ## 2) explicit credentials from 'access_key' and 'secret_key'
# ## 3) shared profile from 'profile'
# ## 4) environment variables
# ## 5) shared credentials file
# ## 6) EC2 Instance Profile
# #access_key = ""
# #secret_key = ""
# #token = ""
# #role_arn = ""
# #profile = ""
# #shared_credential_file = ""
#
# ## Kinesis StreamName must exist prior to starting telegraf.
# streamname = "StreamName"
# ## PartitionKey as used for sharding data.
# partitionkey = "PartitionKey"
# ## If set the paritionKey will be a random UUID on every put.
# ## This allows for scaling across multiple shards in a stream.
# ## This will cause issues with ordering.
# use_random_partitionkey = false
#
#
# ## Data format to output.
# ## Each data format has its own unique set of configuration options, read
# ## more about them here:
# ## https://github.com/influxdata/telegraf/blob/master/docs/DATA_FORMATS_OUTPUT.md
# data_format = "influx"
#
# ## debug will show upstream aws messages.
# debug = false
# # Configuration for Librato API to send metrics to.
# [[outputs.librato]]
# ## Librator API Docs
# ## http://dev.librato.com/v1/metrics-authentication
# ## Librato API user
# api_user = "telegraf@influxdb.com" # required.
# ## Librato API token
# api_token = "my-secret-token" # required.
# ## Debug
# # debug = false
# ## Connection timeout.
# # timeout = "5s"
# ## Output source Template (same as graphite buckets)
# ## see https://github.com/influxdata/telegraf/blob/master/docs/DATA_FORMATS_OUTPUT.md#graphite
# ## This template is used in librato's source (not metric's name)
# template = "host"
#
# # Configuration for MQTT server to send metrics to
# [[outputs.mqtt]]
# servers = ["localhost:1883"] # required.
#
# ## MQTT outputs send metrics to this topic format
# ## "<topic_prefix>/<hostname>/<pluginname>/"
# ## ex: prefix/web01.example.com/mem
# topic_prefix = "telegraf"
#
# ## username and password to connect MQTT server.
# # username = "telegraf"
# # password = "metricsmetricsmetricsmetrics"
#
# ## client ID, if not set a random ID is generated
# # client_id = ""
#
# ## Optional SSL Config
# # ssl_ca = "/etc/telegraf/ca.pem"
# # ssl_cert = "/etc/telegraf/cert.pem"
# # ssl_key = "/etc/telegraf/key.pem"
# ## Use SSL but skip chain & host verification
# # insecure_skip_verify = false
#
# ## Data format to output.
# ## Each data format has its own unique set of configuration options, read
# ## more about them here:
# ## https://github.com/influxdata/telegraf/blob/master/docs/DATA_FORMATS_OUTPUT.md
# data_format = "influx"
# # Send telegraf measurements to NATS
# [[outputs.nats]]
# ## URLs of NATS servers
# servers = ["nats://localhost:4222"]
# ## Optional credentials
# # username = ""
# # password = ""
# ## NATS subject for producer messages
# subject = "telegraf"
#
# ## Optional SSL Config
# # ssl_ca = "/etc/telegraf/ca.pem"
# # ssl_cert = "/etc/telegraf/cert.pem"
# # ssl_key = "/etc/telegraf/key.pem"
# ## Use SSL but skip chain & host verification
# # insecure_skip_verify = false
#
# ## Data format to output.
# ## Each data format has its own unique set of configuration options, read
# ## more about them here:
# ## https://github.com/influxdata/telegraf/blob/master/docs/DATA_FORMATS_OUTPUT.md
# data_format = "influx"
# # Send telegraf measurements to NSQD
# [[outputs.nsq]]
# ## Location of nsqd instance listening on TCP
# server = "localhost:4150"
# ## NSQ topic for producer messages
# topic = "telegraf"
#
# ## Data format to output.
# ## Each data format has its own unique set of configuration options, read
# ## more about them here:
# ## https://github.com/influxdata/telegraf/blob/master/docs/DATA_FORMATS_OUTPUT.md
# data_format = "influx"
# # Configuration for OpenTSDB server to send metrics to
# [[outputs.opentsdb]]
# ## prefix for metrics keys
# prefix = "my.specific.prefix."
#
# ## DNS name of the OpenTSDB server
# ## Using "opentsdb.example.com" or "tcp://opentsdb.example.com" will use the
# ## telnet API. "http://opentsdb.example.com" will use the Http API.
# host = "opentsdb.example.com"
#
# ## Port of the OpenTSDB server
# port = 4242
#
# ## Number of data points to send to OpenTSDB in Http requests.
# ## Not used with telnet API.
# httpBatchSize = 50
#
# ## Debug true - Prints OpenTSDB communication
# debug = false
# # Configuration for the Prometheus client to spawn
# [[outputs.prometheus_client]]
# ## Address to listen on
# # listen = ":9273"
#
# ## Interval to expire metrics and not deliver to prometheus, 0 == no expiration
# # expiration_interval = "60s"
# # Configuration for the Riemann server to send metrics to
# [[outputs.riemann]]
# ## The full TCP or UDP URL of the Riemann server
# url = "tcp://localhost:5555"
#
# ## Riemann event TTL, floating-point time in seconds.
# ## Defines how long that an event is considered valid for in Riemann
# # ttl = 30.0
#
# ## Separator to use between measurement and field name in Riemann service name
# ## This does not have any effect if 'measurement_as_attribute' is set to 'true'
# separator = "/"
#
# ## Set measurement name as Riemann attribute 'measurement', instead of prepending it to the Riemann service name
# # measurement_as_attribute = false
#
# ## Send string metrics as Riemann event states.
# ## Unless enabled all string metrics will be ignored
# # string_as_state = false
#
# ## A list of tag keys whose values get sent as Riemann tags.
# ## If empty, all Telegraf tag values will be sent as tags
# # tag_keys = ["telegraf","custom_tag"]
#
# ## Additional Riemann tags to send.
# # tags = ["telegraf-output"]
#
# ## Description for Riemann event
# # description_text = "metrics collected from telegraf"
#
# ## Riemann client write timeout, defaults to "5s" if not set.
# # timeout = "5s"
# # Configuration for the Riemann server to send metrics to
# [[outputs.riemann_legacy]]
# ## URL of server
# url = "localhost:5555"
# ## transport protocol to use either tcp or udp
# transport = "tcp"
# ## separator to use between input name and field name in Riemann service name
# separator = " "
# # Generic socket writer capable of handling multiple socket types.
# [[outputs.socket_writer]]
# ## URL to connect to
# # address = "tcp://127.0.0.1:8094"
# # address = "tcp://example.com:http"
# # address = "tcp4://127.0.0.1:8094"
# # address = "tcp6://127.0.0.1:8094"
# # address = "tcp6://[2001:db8::1]:8094"
# # address = "udp://127.0.0.1:8094"
# # address = "udp4://127.0.0.1:8094"
# # address = "udp6://127.0.0.1:8094"
# # address = "unix:///tmp/telegraf.sock"
# # address = "unixgram:///tmp/telegraf.sock"
#
# ## Period between keep alive probes.
# ## Only applies to TCP sockets.
# ## 0 disables keep alive probes.
# ## Defaults to the OS configuration.
# # keep_alive_period = "5m"
#
# ## Data format to generate.
# ## Each data format has its own unique set of configuration options, read
# ## more about them here:
# ## https://github.com/influxdata/telegraf/blob/master/docs/DATA_FORMATS_INPUT.md
# # data_format = "influx"
###############################################################################
# PROCESSOR PLUGINS #
###############################################################################
# # Print all metrics that pass through this filter.
# [[processors.printer]]
###############################################################################
# AGGREGATOR PLUGINS #
###############################################################################
# # Create aggregate histograms.
# [[aggregators.histogram]]
# ## The period in which to flush the aggregator.
# period = "30s"
#
# ## If true, the original metric will be dropped by the
# ## aggregator and will not get sent to the output plugins.
# drop_original = false
#
# ## Example config that aggregates all fields of the metric.
# # [[aggregators.histogram.config]]
# # ## The set of buckets.
# # buckets = [0.0, 15.6, 34.5, 49.1, 71.5, 80.5, 94.5, 100.0]
# # ## The name of metric.
# # measurement_name = "cpu"
#
# ## Example config that aggregates only specific fields of the metric.
# # [[aggregators.histogram.config]]
# # ## The set of buckets.
# # buckets = [0.0, 10.0, 20.0, 30.0, 40.0, 50.0, 60.0, 70.0, 80.0, 90.0, 100.0]
# # ## The name of metric.
# # measurement_name = "diskio"
# # ## The concrete fields of metric
# # fields = ["io_time", "read_time", "write_time"]
# # Keep the aggregate min/max of each metric passing through.
# [[aggregators.minmax]]
# ## General Aggregator Arguments:
# ## The period on which to flush & clear the aggregator.
# period = "30s"
# ## If true, the original metric will be dropped by the
# ## aggregator and will not get sent to the output plugins.
# drop_original = false
###############################################################################
# INPUT PLUGINS #
###############################################################################
# Read metrics about cpu usage
[[inputs.cpu]]
## Whether to report per-cpu stats or not
percpu = true
## Whether to report total system cpu stats or not
totalcpu = true
## If true, collect raw CPU time metrics.
collect_cpu_time = false
## If true, compute and report the sum of all non-idle CPU states.
report_active = false
# Read metrics about disk usage by mount point
[[inputs.disk]]
## By default, telegraf gather stats for all mountpoints.
## Setting mountpoints will restrict the stats to the specified mountpoints.
# mount_points = ["/"]
## Ignore some mountpoints by filesystem type. For example (dev)tmpfs (usually
## present on /run, /var/run, /dev/shm or /dev).
ignore_fs = ["tmpfs", "devtmpfs", "devfs"]
# Read metrics about disk IO by device
[[inputs.diskio]]
## By default, telegraf will gather stats for all devices including
## disk partitions.
## Setting devices will restrict the stats to the specified devices.
# devices = ["sda", "sdb"]
## Uncomment the following line if you need disk serial numbers.
# skip_serial_number = false
#
## On systems which support it, device metadata can be added in the form of
## tags.
## Currently only Linux is supported via udev properties. You can view
## available properties for a device by running:
## 'udevadm info -q property -n /dev/sda'
# device_tags = ["ID_FS_TYPE", "ID_FS_USAGE"]
#
## Using the same metadata source as device_tags, you can also customize the
## name of the device via templates.
## The 'name_templates' parameter is a list of templates to try and apply to
## the device. The template may contain variables in the form of '$PROPERTY' or
## '${PROPERTY}'. The first template which does not contain any variables not
## present for the device is used as the device name tag.
## The typical use case is for LVM volumes, to get the VG/LV name instead of
## the near-meaningless DM-0 name.
# name_templates = ["$ID_FS_LABEL","$DM_VG_NAME/$DM_LV_NAME"]
# Get kernel statistics from /proc/stat
[[inputs.kernel]]
# no configuration
# Read metrics about memory usage
[[inputs.mem]]
# no configuration
# Get the number of processes and group them by status
[[inputs.processes]]
# no configuration
# Read metrics about swap memory usage
[[inputs.swap]]
# no configuration
# Read metrics about system load & uptime
[[inputs.system]]
# no configuration
# # Read stats from aerospike server(s)
# [[inputs.aerospike]]
# ## Aerospike servers to connect to (with port)
# ## This plugin will query all namespaces the aerospike
# ## server has configured and get stats for them.
# servers = ["localhost:3000"]
# # Read Apache status information (mod_status)
# [[inputs.apache]]
# ## An array of URLs to gather from, must be directed at the machine
# ## readable version of the mod_status page including the auto query string.
# ## Default is "http://localhost/server-status?auto".
# urls = ["http://localhost/server-status?auto"]
#
# ## Credentials for basic HTTP authentication.
# # username = "myuser"
# # password = "mypassword"
#
# ## Maximum time to receive response.
# # response_timeout = "5s"
#
# ## Optional SSL Config
# # ssl_ca = "/etc/telegraf/ca.pem"
# # ssl_cert = "/etc/telegraf/cert.pem"
# # ssl_key = "/etc/telegraf/key.pem"
# ## Use SSL but skip chain & host verification
# # insecure_skip_verify = false
# # Read metrics of bcache from stats_total and dirty_data
# [[inputs.bcache]]
# ## Bcache sets path
# ## If not specified, then default is:
# bcachePath = "/sys/fs/bcache"
#
# ## By default, telegraf gather stats for all bcache devices
# ## Setting devices will restrict the stats to the specified
# ## bcache devices.
# bcacheDevs = ["bcache0"]
# # Read Cassandra metrics through Jolokia
# [[inputs.cassandra]]
# # This is the context root used to compose the jolokia url
# context = "/jolokia/read"
# ## List of cassandra servers exposing jolokia read service
# servers = ["myuser:mypassword@10.10.10.1:8778","10.10.10.2:8778",":8778"]
# ## List of metrics collected on above servers
# ## Each metric consists of a jmx path.
# ## This will collect all heap memory usage metrics from the jvm and
# ## ReadLatency metrics for all keyspaces and tables.
# ## "type=Table" in the query works with Cassandra3.0. Older versions might
# ## need to use "type=ColumnFamily"
# metrics = [
# "/java.lang:type=Memory/HeapMemoryUsage",
# "/org.apache.cassandra.metrics:type=Table,keyspace=*,scope=*,name=ReadLatency"
# ]
# # Collects performance metrics from the MON and OSD nodes in a Ceph storage cluster.
# [[inputs.ceph]]
# ## This is the recommended interval to poll. Too frequent and you will lose
# ## data points due to timeouts during rebalancing and recovery
# interval = '1m'
#
# ## All configuration values are optional, defaults are shown below
#
# ## location of ceph binary
# ceph_binary = "/usr/bin/ceph"
#
# ## directory in which to look for socket files
# socket_dir = "/var/run/ceph"
#
# ## prefix of MON and OSD socket files, used to determine socket type
# mon_prefix = "ceph-mon"
# osd_prefix = "ceph-osd"
#
# ## suffix used to identify socket files
# socket_suffix = "asok"
#
# ## Ceph user to authenticate as
# ceph_user = "client.admin"
#
# ## Ceph configuration to use to locate the cluster
# ceph_config = "/etc/ceph/ceph.conf"
#
# ## Whether to gather statistics via the admin socket
# gather_admin_socket_stats = true
#
# ## Whether to gather statistics via ceph commands
# gather_cluster_stats = false
# # Read specific statistics per cgroup
# [[inputs.cgroup]]
# ## Directories in which to look for files, globs are supported.
# ## Consider restricting paths to the set of cgroups you really
# ## want to monitor if you have a large number of cgroups, to avoid
# ## any cardinality issues.
# # paths = [
# # "/cgroup/memory",
# # "/cgroup/memory/child1",
# # "/cgroup/memory/child2/*",
# # ]
# ## cgroup stat fields, as file names, globs are supported.
# ## these file names are appended to each path from above.
# # files = ["memory.*usage*", "memory.limit_in_bytes"]
# # Get standard chrony metrics, requires chronyc executable.
# [[inputs.chrony]]
# ## If true, chronyc tries to perform a DNS lookup for the time server.
# # dns_lookup = false
# # Pull Metric Statistics from Amazon CloudWatch
# [[inputs.cloudwatch]]
# ## Amazon Region
# region = "us-east-1"
#
# ## Amazon Credentials
# ## Credentials are loaded in the following order
# ## 1) Assumed credentials via STS if role_arn is specified
# ## 2) explicit credentials from 'access_key' and 'secret_key'
# ## 3) shared profile from 'profile'
# ## 4) environment variables
# ## 5) shared credentials file
# ## 6) EC2 Instance Profile
# #access_key = ""
# #secret_key = ""
# #token = ""
# #role_arn = ""
# #profile = ""
# #shared_credential_file = ""
#
# # The minimum period for Cloudwatch metrics is 1 minute (60s). However not all
# # metrics are made available to the 1 minute period. Some are collected at
# # 3 minute, 5 minute, or larger intervals. See https://aws.amazon.com/cloudwatch/faqs/#monitoring.
# # Note that if a period is configured that is smaller than the minimum for a
# # particular metric, that metric will not be returned by the Cloudwatch API
# # and will not be collected by Telegraf.
# #
# ## Requested CloudWatch aggregation Period (required - must be a multiple of 60s)
# period = "5m"
#
# ## Collection Delay (required - must account for metrics availability via CloudWatch API)
# delay = "5m"
#
# ## Recomended: use metric 'interval' that is a multiple of 'period' to avoid
# ## gaps or overlap in pulled data
# interval = "5m"
#
# ## Configure the TTL for the internal cache of metrics.
# ## Defaults to 1 hr if not specified
# #cache_ttl = "10m"
#
# ## Metric Statistic Namespace (required)
# namespace = "AWS/ELB"
#
# ## Maximum requests per second. Note that the global default AWS rate limit is
# ## 400 reqs/sec, so if you define multiple namespaces, these should add up to a
# ## maximum of 400. Optional - default value is 200.
# ## See http://docs.aws.amazon.com/AmazonCloudWatch/latest/monitoring/cloudwatch_limits.html
# ratelimit = 200
#
# ## Metrics to Pull (optional)
# ## Defaults to all Metrics in Namespace if nothing is provided
# ## Refreshes Namespace available metrics every 1h
# #[[inputs.cloudwatch.metrics]]
# # names = ["Latency", "RequestCount"]
# #
# # ## Dimension filters for Metric (optional)
# # [[inputs.cloudwatch.metrics.dimensions]]
# # name = "LoadBalancerName"
# # value = "p-example"
# # Collects conntrack stats from the configured directories and files.
# [[inputs.conntrack]]
# ## The following defaults would work with multiple versions of conntrack.
# ## Note the nf_ and ip_ filename prefixes are mutually exclusive across
# ## kernel versions, as are the directory locations.
#
# ## Superset of filenames to look for within the conntrack dirs.
# ## Missing files will be ignored.
# files = ["ip_conntrack_count","ip_conntrack_max",
# "nf_conntrack_count","nf_conntrack_max"]
#
# ## Directories to search within for the conntrack files above.
# ## Missing directrories will be ignored.
# dirs = ["/proc/sys/net/ipv4/netfilter","/proc/sys/net/netfilter"]
# # Gather health check statuses from services registered in Consul
# [[inputs.consul]]
# ## Most of these values defaults to the one configured on a Consul's agent level.
# ## Optional Consul server address (default: "localhost")
# # address = "localhost"
# ## Optional URI scheme for the Consul server (default: "http")
# # scheme = "http"
# ## Optional ACL token used in every request (default: "")
# # token = ""
# ## Optional username used for request HTTP Basic Authentication (default: "")
# # username = ""
# ## Optional password used for HTTP Basic Authentication (default: "")
# # password = ""
# ## Optional data centre to query the health checks from (default: "")
# # datacentre = ""
# # Read metrics from one or many couchbase clusters
# [[inputs.couchbase]]
# ## specify servers via a url matching:
# ## [protocol://][:password]@address[:port]
# ## e.g.
# ## http://couchbase-0.example.com/
# ## http://admin:secret@couchbase-0.example.com:8091/
# ##
# ## If no servers are specified, then localhost is used as the host.
# ## If no protocol is specifed, HTTP is used.
# ## If no port is specified, 8091 is used.
# servers = ["http://localhost:8091"]
# # Read CouchDB Stats from one or more servers
# [[inputs.couchdb]]
# ## Works with CouchDB stats endpoints out of the box
# ## Multiple HOSTs from which to read CouchDB stats:
# hosts = ["http://localhost:8086/_stats"]
# # Read metrics from one or many disque servers
# [[inputs.disque]]
# ## An array of URI to gather stats about. Specify an ip or hostname
# ## with optional port and password.
# ## ie disque://localhost, disque://10.10.3.33:18832, 10.0.0.1:10000, etc.
# ## If no servers are specified, then localhost is used as the host.
# servers = ["localhost"]
# # Provide a native collection for dmsetup based statistics for dm-cache
# [[inputs.dmcache]]
# ## Whether to report per-device stats or not
# per_device = true
# # Query given DNS server and gives statistics
# [[inputs.dns_query]]
# ## servers to query
# servers = ["8.8.8.8"]
#
# ## Network is the network protocol name.
# # network = "udp"
#
# ## Domains or subdomains to query.
# # domains = ["."]
#
# ## Query record type.
# ## Posible values: A, AAAA, CNAME, MX, NS, PTR, TXT, SOA, SPF, SRV.
# # record_type = "A"
#
# ## Dns server port.
# # port = 53
#
# ## Query timeout in seconds.
# # timeout = 2
# # Read metrics about docker containers
# [[inputs.docker]]
# ## Docker Endpoint
# ## To use TCP, set endpoint = "tcp://[ip]:[port]"
# ## To use environment variables (ie, docker-machine), set endpoint = "ENV"
# endpoint = "unix:///var/run/docker.sock"
#
# ## Only collect metrics for these containers, collect all if empty
# container_names = []
#
# ## Containers to include and exclude. Globs accepted.
# ## Note that an empty array for both will include all containers
# container_name_include = []
# container_name_exclude = []
#
# ## Timeout for docker list, info, and stats commands
# timeout = "5s"
#
# ## Whether to report for each container per-device blkio (8:0, 8:1...) and
# ## network (eth0, eth1, ...) stats or not
# perdevice = true
# ## Whether to report for each container total blkio and network stats or not
# total = false
# ## Which environment variables should we use as a tag
# ##tag_env = ["JAVA_HOME", "HEAP_SIZE"]
#
# ## docker labels to include and exclude as tags. Globs accepted.
# ## Note that an empty array for both will include all labels as tags
# docker_label_include = []
# docker_label_exclude = []
#
# ## Optional SSL Config
# # ssl_ca = "/etc/telegraf/ca.pem"
# # ssl_cert = "/etc/telegraf/cert.pem"
# # ssl_key = "/etc/telegraf/key.pem"
# ## Use SSL but skip chain & host verification
# # insecure_skip_verify = false
# # Read statistics from one or many dovecot servers
# [[inputs.dovecot]]
# ## specify dovecot servers via an address:port list
# ## e.g.
# ## localhost:24242
# ##
# ## If no servers are specified, then localhost is used as the host.
# servers = ["localhost:24242"]
# ## Type is one of "user", "domain", "ip", or "global"
# type = "global"
# ## Wildcard matches like "*.com". An empty string "" is same as "*"
# ## If type = "ip" filters should be <IP/network>
# filters = [""]
# # Read stats from one or more Elasticsearch servers or clusters
# [[inputs.elasticsearch]]
# ## specify a list of one or more Elasticsearch servers
# # you can add username and password to your url to use basic authentication:
# # servers = ["http://user:pass@localhost:9200"]
# servers = ["http://localhost:9200"]
#
# ## Timeout for HTTP requests to the elastic search server(s)
# http_timeout = "5s"
#
# ## When local is true (the default), the node will read only its own stats.
# ## Set local to false when you want to read the node stats from all nodes
# ## of the cluster.
# local = true
#
# ## Set cluster_health to true when you want to also obtain cluster health stats
# cluster_health = false
#
# ## Set cluster_stats to true when you want to also obtain cluster stats from the
# ## Master node.
# cluster_stats = false
#
# ## Optional SSL Config
# # ssl_ca = "/etc/telegraf/ca.pem"
# # ssl_cert = "/etc/telegraf/cert.pem"
# # ssl_key = "/etc/telegraf/key.pem"
# ## Use SSL but skip chain & host verification
# # insecure_skip_verify = false
# # Read metrics from one or more commands that can output to stdout
# [[inputs.exec]]
# ## Commands array
# commands = [
# "/tmp/test.sh",
# "/usr/bin/mycollector --foo=bar",
# "/tmp/collect_*.sh"
# ]
#
# ## Timeout for each command to complete.
# timeout = "5s"
#
# ## measurement name suffix (for separating different commands)
# name_suffix = "_mycollector"
#
# ## Data format to consume.
# ## Each data format has its own unique set of configuration options, read
# ## more about them here:
# ## https://github.com/influxdata/telegraf/blob/master/docs/DATA_FORMATS_INPUT.md
# data_format = "influx"
# # Read metrics from fail2ban.
# [[inputs.fail2ban]]
# ## fail2ban-client require root access.
# ## Setting 'use_sudo' to true will make use of sudo to run fail2ban-client.
# ## Users must configure sudo to allow telegraf user to run fail2ban-client with no password.
# ## This plugin run only "fail2ban-client status".
# use_sudo = false
# # Read stats about given file(s)
# [[inputs.filestat]]
# ## Files to gather stats about.
# ## These accept standard unix glob matching rules, but with the addition of
# ## ** as a "super asterisk". ie:
# ## "/var/log/**.log" -> recursively find all .log files in /var/log
# ## "/var/log/*/*.log" -> find all .log files with a parent dir in /var/log
# ## "/var/log/apache.log" -> just tail the apache log file
# ##
# ## See https://github.com/gobwas/glob for more examples
# ##
# files = ["/var/log/**.log"]
# ## If true, read the entire file and calculate an md5 checksum.
# md5 = false
# # Read metrics exposed by fluentd in_monitor plugin
# [[inputs.fluentd]]
# ## This plugin reads information exposed by fluentd (using /api/plugins.json endpoint).
# ##
# ## Endpoint:
# ## - only one URI is allowed
# ## - https is not supported
# endpoint = "http://localhost:24220/api/plugins.json"
#
# ## Define which plugins have to be excluded (based on "type" field - e.g. monitor_agent)
# exclude = [
# "monitor_agent",
# "dummy",
# ]
# # Read flattened metrics from one or more GrayLog HTTP endpoints
# [[inputs.graylog]]
# ## API endpoint, currently supported API:
# ##
# ## - multiple (Ex http://<host>:12900/system/metrics/multiple)
# ## - namespace (Ex http://<host>:12900/system/metrics/namespace/{namespace})
# ##
# ## For namespace endpoint, the metrics array will be ignored for that call.
# ## Endpoint can contain namespace and multiple type calls.
# ##
# ## Please check http://[graylog-server-ip]:12900/api-browser for full list
# ## of endpoints
# servers = [
# "http://[graylog-server-ip]:12900/system/metrics/multiple",
# ]
#
# ## Metrics list
# ## List of metrics can be found on Graylog webservice documentation.
# ## Or by hitting the the web service api at:
# ## http://[graylog-host]:12900/system/metrics
# metrics = [
# "jvm.cl.loaded",
# "jvm.memory.pools.Metaspace.committed"
# ]
#
# ## Username and password
# username = ""
# password = ""
#
# ## Optional SSL Config
# # ssl_ca = "/etc/telegraf/ca.pem"
# # ssl_cert = "/etc/telegraf/cert.pem"
# # ssl_key = "/etc/telegraf/key.pem"
# ## Use SSL but skip chain & host verification
# # insecure_skip_verify = false
# # Read metrics of haproxy, via socket or csv stats page
# [[inputs.haproxy]]
# ## An array of address to gather stats about. Specify an ip on hostname
# ## with optional port. ie localhost, 10.10.3.33:1936, etc.
# ## Make sure you specify the complete path to the stats endpoint
# ## including the protocol, ie http://10.10.3.33:1936/haproxy?stats
#
# ## If no servers are specified, then default to 127.0.0.1:1936/haproxy?stats
# servers = ["http://myhaproxy.com:1936/haproxy?stats"]
#
# ## You can also use local socket with standard wildcard globbing.
# ## Server address not starting with 'http' will be treated as a possible
# ## socket, so both examples below are valid.
# # servers = ["socket:/run/haproxy/admin.sock", "/run/haproxy/*.sock"]
#
# ## By default, some of the fields are renamed from what haproxy calls them.
# ## Setting this option to true results in the plugin keeping the original
# ## field names.
# # keep_field_names = true
#
# ## Optional SSL Config
# # ssl_ca = "/etc/telegraf/ca.pem"
# # ssl_cert = "/etc/telegraf/cert.pem"
# # ssl_key = "/etc/telegraf/key.pem"
# ## Use SSL but skip chain & host verification
# # insecure_skip_verify = false
# # Monitor disks' temperatures using hddtemp
# [[inputs.hddtemp]]
# ## By default, telegraf gathers temps data from all disks detected by the
# ## hddtemp.
# ##
# ## Only collect temps from the selected disks.
# ##
# ## A * as the device name will return the temperature values of all disks.
# ##
# # address = "127.0.0.1:7634"
# # devices = ["sda", "*"]
# # HTTP/HTTPS request given an address a method and a timeout
# [[inputs.http_response]]
# ## Server address (default http://localhost)
# # address = "http://localhost"
#
# ## Set response_timeout (default 5 seconds)
# # response_timeout = "5s"
#
# ## HTTP Request Method
# # method = "GET"
#
# ## Whether to follow redirects from the server (defaults to false)
# # follow_redirects = false
#
# ## Optional HTTP Request Body
# # body = '''
# # {'fake':'data'}
# # '''
#
# ## Optional substring or regex match in body of the response
# # response_string_match = "\"service_status\": \"up\""
# # response_string_match = "ok"
# # response_string_match = "\".*_status\".?:.?\"up\""
#
# ## Optional SSL Config
# # ssl_ca = "/etc/telegraf/ca.pem"
# # ssl_cert = "/etc/telegraf/cert.pem"
# # ssl_key = "/etc/telegraf/key.pem"
# ## Use SSL but skip chain & host verification
# # insecure_skip_verify = false
#
# ## HTTP Request Headers (all values must be strings)
# # [inputs.http_response.headers]
# # Host = "github.com"
# # Read flattened metrics from one or more JSON HTTP endpoints
# [[inputs.httpjson]]
# ## NOTE This plugin only reads numerical measurements, strings and booleans
# ## will be ignored.
#
# ## Name for the service being polled. Will be appended to the name of the
# ## measurement e.g. httpjson_webserver_stats
# ##
# ## Deprecated (1.3.0): Use name_override, name_suffix, name_prefix instead.
# name = "webserver_stats"
#
# ## URL of each server in the service's cluster
# servers = [
# "http://localhost:9999/stats/",
# "http://localhost:9998/stats/",
# ]
# ## Set response_timeout (default 5 seconds)
# response_timeout = "5s"
#
# ## HTTP method to use: GET or POST (case-sensitive)
# method = "GET"
#
# ## List of tag names to extract from top-level of JSON server response
# # tag_keys = [
# # "my_tag_1",
# # "my_tag_2"
# # ]
#
# ## HTTP parameters (all values must be strings). For "GET" requests, data
# ## will be included in the query. For "POST" requests, data will be included
# ## in the request body as "x-www-form-urlencoded".
# # [inputs.httpjson.parameters]
# # event_type = "cpu_spike"
# # threshold = "0.75"
#
# ## HTTP Headers (all values must be strings)
# # [inputs.httpjson.headers]
# # X-Auth-Token = "my-xauth-token"
# # apiVersion = "v1"
#
# ## Optional SSL Config
# # ssl_ca = "/etc/telegraf/ca.pem"
# # ssl_cert = "/etc/telegraf/cert.pem"
# # ssl_key = "/etc/telegraf/key.pem"
# ## Use SSL but skip chain & host verification
# # insecure_skip_verify = false
# # Read InfluxDB-formatted JSON metrics from one or more HTTP endpoints
# [[inputs.influxdb]]
# ## Works with InfluxDB debug endpoints out of the box,
# ## but other services can use this format too.
# ## See the influxdb plugin's README for more details.
#
# ## Multiple URLs from which to read InfluxDB-formatted JSON
# ## Default is "http://localhost:8086/debug/vars".
# urls = [
# "http://localhost:8086/debug/vars"
# ]
#
# ## Optional SSL Config
# # ssl_ca = "/etc/telegraf/ca.pem"
# # ssl_cert = "/etc/telegraf/cert.pem"
# # ssl_key = "/etc/telegraf/key.pem"
# ## Use SSL but skip chain & host verification
# # insecure_skip_verify = false
#
# ## http request & header timeout
# timeout = "5s"
# # Collect statistics about itself
# [[inputs.internal]]
# ## If true, collect telegraf memory stats.
# # collect_memstats = true
# # This plugin gathers interrupts data from /proc/interrupts and /proc/softirqs.
# [[inputs.interrupts]]
# ## To filter which IRQs to collect, make use of tagpass / tagdrop, i.e.
# # [inputs.interrupts.tagdrop]
# # irq = [ "NET_RX", "TASKLET" ]
# # Read metrics from the bare metal servers via IPMI
# [[inputs.ipmi_sensor]]
# ## optionally specify the path to the ipmitool executable
# # path = "/usr/bin/ipmitool"
# #
# ## optionally specify one or more servers via a url matching
# ## [username[:password]@][protocol[(address)]]
# ## e.g.
# ## root:passwd@lan(127.0.0.1)
# ##
# ## if no servers are specified, local machine sensor stats will be queried
# ##
# # servers = ["USERID:PASSW0RD@lan(192.168.1.1)"]
#
# ## Recomended: use metric 'interval' that is a multiple of 'timeout' to avoid
# ## gaps or overlap in pulled data
# interval = "30s"
#
# ## Timeout for the ipmitool command to complete
# timeout = "20s"
# # Gather packets and bytes throughput from iptables
# [[inputs.iptables]]
# ## iptables require root access on most systems.
# ## Setting 'use_sudo' to true will make use of sudo to run iptables.
# ## Users must configure sudo to allow telegraf user to run iptables with no password.
# ## iptables can be restricted to only list command "iptables -nvL".
# use_sudo = false
# ## Setting 'use_lock' to true runs iptables with the "-w" option.
# ## Adjust your sudo settings appropriately if using this option ("iptables -wnvl")
# use_lock = false
# ## defines the table to monitor:
# table = "filter"
# ## defines the chains to monitor.
# ## NOTE: iptables rules without a comment will not be monitored.
# ## Read the plugin documentation for more information.
# chains = [ "INPUT" ]
# # Read JMX metrics through Jolokia
# [[inputs.jolokia]]
# ## This is the context root used to compose the jolokia url
# ## NOTE that Jolokia requires a trailing slash at the end of the context root
# ## NOTE that your jolokia security policy must allow for POST requests.
# context = "/jolokia/"
#
# ## This specifies the mode used
# # mode = "proxy"
# #
# ## When in proxy mode this section is used to specify further
# ## proxy address configurations.
# ## Remember to change host address to fit your environment.
# # [inputs.jolokia.proxy]
# # host = "127.0.0.1"
# # port = "8080"
#
# ## Optional http timeouts
# ##
# ## response_header_timeout, if non-zero, specifies the amount of time to wait
# ## for a server's response headers after fully writing the request.
# # response_header_timeout = "3s"
# ##
# ## client_timeout specifies a time limit for requests made by this client.
# ## Includes connection time, any redirects, and reading the response body.
# # client_timeout = "4s"
#
# ## Attribute delimiter
# ##
# ## When multiple attributes are returned for a single
# ## [inputs.jolokia.metrics], the field name is a concatenation of the metric
# ## name, and the attribute name, separated by the given delimiter.
# # delimiter = "_"
#
# ## List of servers exposing jolokia read service
# [[inputs.jolokia.servers]]
# name = "as-server-01"
# host = "127.0.0.1"
# port = "8080"
# # username = "myuser"
# # password = "mypassword"
#
# ## List of metrics collected on above servers
# ## Each metric consists in a name, a jmx path and either
# ## a pass or drop slice attribute.
# ## This collect all heap memory usage metrics.
# [[inputs.jolokia.metrics]]
# name = "heap_memory_usage"
# mbean = "java.lang:type=Memory"
# attribute = "HeapMemoryUsage"
#
# ## This collect thread counts metrics.
# [[inputs.jolokia.metrics]]
# name = "thread_count"
# mbean = "java.lang:type=Threading"
# attribute = "TotalStartedThreadCount,ThreadCount,DaemonThreadCount,PeakThreadCount"
#
# ## This collect number of class loaded/unloaded counts metrics.
# [[inputs.jolokia.metrics]]
# name = "class_count"
# mbean = "java.lang:type=ClassLoading"
# attribute = "LoadedClassCount,UnloadedClassCount,TotalLoadedClassCount"
# # Read Kapacitor-formatted JSON metrics from one or more HTTP endpoints
# [[inputs.kapacitor]]
# ## Multiple URLs from which to read Kapacitor-formatted JSON
# ## Default is "http://localhost:9092/kapacitor/v1/debug/vars".
# urls = [
# "http://localhost:9092/kapacitor/v1/debug/vars"
# ]
#
# ## Time limit for http requests
# timeout = "5s"
# # Get kernel statistics from /proc/vmstat
# [[inputs.kernel_vmstat]]
# # no configuration
# # Read metrics from the kubernetes kubelet api
# [[inputs.kubernetes]]
# ## URL for the kubelet
# url = "http://1.1.1.1:10255"
#
# ## Use bearer token for authorization
# # bearer_token = /path/to/bearer/token
#
# ## Optional SSL Config
# # ssl_ca = /path/to/cafile
# # ssl_cert = /path/to/certfile
# # ssl_key = /path/to/keyfile
# ## Use SSL but skip chain & host verification
# # insecure_skip_verify = false
# # Read metrics from a LeoFS Server via SNMP
# [[inputs.leofs]]
# ## An array of URLs of the form:
# ## "udp://" host [ ":" port]
# servers = ["udp://127.0.0.1:4020"]
# # Provides Linux sysctl fs metrics
# [[inputs.linux_sysctl_fs]]
# # no configuration
# # Read metrics from local Lustre service on OST, MDS
# [[inputs.lustre2]]
# ## An array of /proc globs to search for Lustre stats
# ## If not specified, the default will work on Lustre 2.5.x
# ##
# # ost_procfiles = [
# # "/proc/fs/lustre/obdfilter/*/stats",
# # "/proc/fs/lustre/osd-ldiskfs/*/stats",
# # "/proc/fs/lustre/obdfilter/*/job_stats",
# # ]
# # mds_procfiles = [
# # "/proc/fs/lustre/mdt/*/md_stats",
# # "/proc/fs/lustre/mdt/*/job_stats",
# # ]
# # Gathers metrics from the /3.0/reports MailChimp API
# [[inputs.mailchimp]]
# ## MailChimp API key
# ## get from https://admin.mailchimp.com/account/api/
# api_key = "" # required
# ## Reports for campaigns sent more than days_old ago will not be collected.
# ## 0 means collect all.
# days_old = 0
# ## Campaign ID to get, if empty gets all campaigns, this option overrides days_old
# # campaign_id = ""
# # Read metrics from one or many memcached servers
# [[inputs.memcached]]
# ## An array of address to gather stats about. Specify an ip on hostname
# ## with optional port. ie localhost, 10.0.0.1:11211, etc.
# servers = ["localhost:11211"]
# # unix_sockets = ["/var/run/memcached.sock"]
# # Telegraf plugin for gathering metrics from N Mesos masters
# [[inputs.mesos]]
# ## Timeout, in ms.
# timeout = 100
# ## A list of Mesos masters.
# masters = ["localhost:5050"]
# ## Master metrics groups to be collected, by default, all enabled.
# master_collections = [
# "resources",
# "master",
# "system",
# "agents",
# "frameworks",
# "tasks",
# "messages",
# "evqueue",
# "registrar",
# ]
# ## A list of Mesos slaves, default is []
# # slaves = []
# ## Slave metrics groups to be collected, by default, all enabled.
# # slave_collections = [
# # "resources",
# # "agent",
# # "system",
# # "executors",
# # "tasks",
# # "messages",
# # ]
# # Collects scores from a minecraft server's scoreboard using the RCON protocol
# [[inputs.minecraft]]
# ## server address for minecraft
# # server = "localhost"
# ## port for RCON
# # port = "25575"
# ## password RCON for mincraft server
# # password = ""
# # Read metrics from one or many MongoDB servers
# [[inputs.mongodb]]
# ## An array of URLs of the form:
# ## "mongodb://" [user ":" pass "@"] host [ ":" port]
# ## For example:
# ## mongodb://user:auth_key@10.10.3.30:27017,
# ## mongodb://10.10.3.33:18832,
# servers = ["mongodb://127.0.0.1:27017"]
# gather_perdb_stats = false
#
# ## Optional SSL Config
# # ssl_ca = "/etc/telegraf/ca.pem"
# # ssl_cert = "/etc/telegraf/cert.pem"
# # ssl_key = "/etc/telegraf/key.pem"
# ## Use SSL but skip chain & host verification
# # insecure_skip_verify = false
# # Read metrics from one or many mysql servers
# [[inputs.mysql]]
# ## specify servers via a url matching:
# ## [username[:password]@][protocol[(address)]]/[?tls=[true|false|skip-verify|custom]]
# ## see https://github.com/go-sql-driver/mysql#dsn-data-source-name
# ## e.g.
# ## servers = ["user:passwd@tcp(127.0.0.1:3306)/?tls=false"]
# ## servers = ["user@tcp(127.0.0.1:3306)/?tls=false"]
# #
# ## If no servers are specified, then localhost is used as the host.
# servers = ["tcp(127.0.0.1:3306)/"]
# ## the limits for metrics form perf_events_statements
# perf_events_statements_digest_text_limit = 120
# perf_events_statements_limit = 250
# perf_events_statements_time_limit = 86400
# #
# ## if the list is empty, then metrics are gathered from all databasee tables
# table_schema_databases = []
# #
# ## gather metrics from INFORMATION_SCHEMA.TABLES for databases provided above list
# gather_table_schema = false
# #
# ## gather thread state counts from INFORMATION_SCHEMA.PROCESSLIST
# gather_process_list = true
# #
# ## gather thread state counts from INFORMATION_SCHEMA.USER_STATISTICS
# gather_user_statistics = true
# #
# ## gather auto_increment columns and max values from information schema
# gather_info_schema_auto_inc = true
# #
# ## gather metrics from INFORMATION_SCHEMA.INNODB_METRICS
# gather_innodb_metrics = true
# #
# ## gather metrics from SHOW SLAVE STATUS command output
# gather_slave_status = true
# #
# ## gather metrics from SHOW BINARY LOGS command output
# gather_binary_logs = false
# #
# ## gather metrics from PERFORMANCE_SCHEMA.TABLE_IO_WAITS_SUMMARY_BY_TABLE
# gather_table_io_waits = false
# #
# ## gather metrics from PERFORMANCE_SCHEMA.TABLE_LOCK_WAITS
# gather_table_lock_waits = false
# #
# ## gather metrics from PERFORMANCE_SCHEMA.TABLE_IO_WAITS_SUMMARY_BY_INDEX_USAGE
# gather_index_io_waits = false
# #
# ## gather metrics from PERFORMANCE_SCHEMA.EVENT_WAITS
# gather_event_waits = false
# #
# ## gather metrics from PERFORMANCE_SCHEMA.FILE_SUMMARY_BY_EVENT_NAME
# gather_file_events_stats = false
# #
# ## gather metrics from PERFORMANCE_SCHEMA.EVENTS_STATEMENTS_SUMMARY_BY_DIGEST
# gather_perf_events_statements = false
# #
# ## Some queries we may want to run less often (such as SHOW GLOBAL VARIABLES)
# interval_slow = "30m"
#
# ## Optional SSL Config (will be used if tls=custom parameter specified in server uri)
# ssl_ca = "/etc/telegraf/ca.pem"
# ssl_cert = "/etc/telegraf/cert.pem"
# ssl_key = "/etc/telegraf/key.pem"
# # Read metrics about network interface usage
[[inputs.net]]
# ## By default, telegraf gathers stats from any up interface (excluding loopback)
# ## Setting interfaces will tell it to gather these explicit interfaces,
# ## regardless of status.
# ##
# # interfaces = ["eth0"]
# # TCP or UDP 'ping' given url and collect response time in seconds
# [[inputs.net_response]]
# ## Protocol, must be "tcp" or "udp"
# ## NOTE: because the "udp" protocol does not respond to requests, it requires
# ## a send/expect string pair (see below).
# protocol = "tcp"
# ## Server address (default localhost)
# address = "localhost:80"
# ## Set timeout
# timeout = "1s"
#
# ## Set read timeout (only used if expecting a response)
# read_timeout = "1s"
#
# ## The following options are required for UDP checks. For TCP, they are
# ## optional. The plugin will send the given string to the server and then
# ## expect to receive the given 'expect' string back.
# ## string sent to the server
# # send = "ssh"
# ## expected string in answer
# # expect = "ssh"
# # Read TCP metrics such as established, time wait and sockets counts.
[[inputs.netstat]]
# # no configuration
# # Read Nginx's basic status information (ngx_http_stub_status_module)
# [[inputs.nginx]]
# # An array of Nginx stub_status URI to gather stats.
# urls = ["http://localhost/server_status"]
#
# # TLS/SSL configuration
# ssl_ca = "/etc/telegraf/ca.pem"
# ssl_cert = "/etc/telegraf/cert.cer"
# ssl_key = "/etc/telegraf/key.key"
# insecure_skip_verify = false
#
# # HTTP response timeout (default: 5s)
# response_timeout = "5s"
# # Read NSQ topic and channel statistics.
# [[inputs.nsq]]
# ## An array of NSQD HTTP API endpoints
# endpoints = ["http://localhost:4151"]
# # Collect kernel snmp counters and network interface statistics
# [[inputs.nstat]]
# ## file paths for proc files. If empty default paths will be used:
# ## /proc/net/netstat, /proc/net/snmp, /proc/net/snmp6
# ## These can also be overridden with env variables, see README.
# proc_net_netstat = "/proc/net/netstat"
# proc_net_snmp = "/proc/net/snmp"
# proc_net_snmp6 = "/proc/net/snmp6"
# ## dump metrics with 0 values too
# dump_zeros = true
# # Get standard NTP query metrics, requires ntpq executable.
# [[inputs.ntpq]]
# ## If false, set the -n ntpq flag. Can reduce metric gather time.
# dns_lookup = true
# # OpenLDAP cn=Monitor plugin
# [[inputs.openldap]]
# host = "localhost"
# port = 389
#
# # ldaps, starttls, or no encryption. default is an empty string, disabling all encryption.
# # note that port will likely need to be changed to 636 for ldaps
# # valid options: "" | "starttls" | "ldaps"
# ssl = ""
#
# # skip peer certificate verification. Default is false.
# insecure_skip_verify = false
#
# # Path to PEM-encoded Root certificate to use to verify server certificate
# ssl_ca = "/etc/ssl/certs.pem"
#
# # dn/password to bind with. If bind_dn is empty, an anonymous bind is performed.
# bind_dn = ""
# bind_password = ""
# # Read metrics of passenger using passenger-status
# [[inputs.passenger]]
# ## Path of passenger-status.
# ##
# ## Plugin gather metric via parsing XML output of passenger-status
# ## More information about the tool:
# ## https://www.phusionpassenger.com/library/admin/apache/overall_status_report.html
# ##
# ## If no path is specified, then the plugin simply execute passenger-status
# ## hopefully it can be found in your PATH
# command = "passenger-status -v --show=xml"
# # Read metrics of phpfpm, via HTTP status page or socket
# [[inputs.phpfpm]]
# ## An array of addresses to gather stats about. Specify an ip or hostname
# ## with optional port and path
# ##
# ## Plugin can be configured in three modes (either can be used):
# ## - http: the URL must start with http:// or https://, ie:
# ## "http://localhost/status"
# ## "http://192.168.130.1/status?full"
# ##
# ## - unixsocket: path to fpm socket, ie:
# ## "/var/run/php5-fpm.sock"
# ## or using a custom fpm status path:
# ## "/var/run/php5-fpm.sock:fpm-custom-status-path"
# ##
# ## - fcgi: the URL must start with fcgi:// or cgi://, and port must be present, ie:
# ## "fcgi://10.0.0.12:9000/status"
# ## "cgi://10.0.10.12:9001/status"
# ##
# ## Example of multiple gathering from local socket and remove host
# ## urls = ["http://192.168.1.20/status", "/tmp/fpm.sock"]
# urls = ["http://localhost/status"]
# # Ping given url(s) and return statistics
# [[inputs.ping]]
# ## NOTE: this plugin forks the ping command. You may need to set capabilities
# ## via setcap cap_net_raw+p /bin/ping
# #
# ## List of urls to ping
# urls = ["www.google.com"] # required
# ## number of pings to send per collection (ping -c <COUNT>)
# # count = 1
# ## interval, in s, at which to ping. 0 == default (ping -i <PING_INTERVAL>)
# # ping_interval = 1.0
# ## per-ping timeout, in s. 0 == no timeout (ping -W <TIMEOUT>)
# # timeout = 1.0
# ## interface to send ping from (ping -I <INTERFACE>)
# # interface = ""
# # Read metrics from one or many postgresql servers
# [[inputs.postgresql]]
# ## specify address via a url matching:
# ## postgres://[pqgotest[:password]]@localhost[/dbname]\
# ## ?sslmode=[disable|verify-ca|verify-full]
# ## or a simple string:
# ## host=localhost user=pqotest password=... sslmode=... dbname=app_production
# ##
# ## All connection parameters are optional.
# ##
# ## Without the dbname parameter, the driver will default to a database
# ## with the same name as the user. This dbname is just for instantiating a
# ## connection with the server and doesn't restrict the databases we are trying
# ## to grab metrics for.
# ##
# address = "host=localhost user=postgres sslmode=disable"
#
# ## A list of databases to explicitly ignore. If not specified, metrics for all
# ## databases are gathered. Do NOT use with the 'databases' option.
# # ignored_databases = ["postgres", "template0", "template1"]
#
# ## A list of databases to pull metrics about. If not specified, metrics for all
# ## databases are gathered. Do NOT use with the 'ignored_databases' option.
# # databases = ["app_production", "testing"]
# # Read metrics from one or many postgresql servers
# [[inputs.postgresql_extensible]]
# ## specify address via a url matching:
# ## postgres://[pqgotest[:password]]@localhost[/dbname]\
# ## ?sslmode=[disable|verify-ca|verify-full]
# ## or a simple string:
# ## host=localhost user=pqotest password=... sslmode=... dbname=app_production
# #
# ## All connection parameters are optional. #
# ## Without the dbname parameter, the driver will default to a database
# ## with the same name as the user. This dbname is just for instantiating a
# ## connection with the server and doesn't restrict the databases we are trying
# ## to grab metrics for.
# #
# address = "host=localhost user=postgres sslmode=disable"
# ## A list of databases to pull metrics about. If not specified, metrics for all
# ## databases are gathered.
# ## databases = ["app_production", "testing"]
# #
# # outputaddress = "db01"
# ## A custom name for the database that will be used as the "server" tag in the
# ## measurement output. If not specified, a default one generated from
# ## the connection address is used.
# #
# ## Define the toml config where the sql queries are stored
# ## New queries can be added, if the withdbname is set to true and there is no
# ## databases defined in the 'databases field', the sql query is ended by a
# ## 'is not null' in order to make the query succeed.
# ## Example :
# ## The sqlquery : "SELECT * FROM pg_stat_database where datname" become
# ## "SELECT * FROM pg_stat_database where datname IN ('postgres', 'pgbench')"
# ## because the databases variable was set to ['postgres', 'pgbench' ] and the
# ## withdbname was true. Be careful that if the withdbname is set to false you
# ## don't have to define the where clause (aka with the dbname) the tagvalue
# ## field is used to define custom tags (separated by commas)
# ## The optional "measurement" value can be used to override the default
# ## output measurement name ("postgresql").
# #
# ## Structure :
# ## [[inputs.postgresql_extensible.query]]
# ## sqlquery string
# ## version string
# ## withdbname boolean
# ## tagvalue string (comma separated)
# ## measurement string
# [[inputs.postgresql_extensible.query]]
# sqlquery="SELECT * FROM pg_stat_database"
# version=901
# withdbname=false
# tagvalue=""
# measurement=""
# [[inputs.postgresql_extensible.query]]
# sqlquery="SELECT * FROM pg_stat_bgwriter"
# version=901
# withdbname=false
# tagvalue="postgresql.stats"
# # Read metrics from one or many PowerDNS servers
# [[inputs.powerdns]]
# ## An array of sockets to gather stats about.
# ## Specify a path to unix socket.
# unix_sockets = ["/var/run/pdns.controlsocket"]
# # Monitor process cpu and memory usage
# [[inputs.procstat]]
# ## Must specify one of: pid_file, exe, or pattern
# ## PID file to monitor process
# pid_file = "/var/run/nginx.pid"
# ## executable name (ie, pgrep <exe>)
# # exe = "nginx"
# ## pattern as argument for pgrep (ie, pgrep -f <pattern>)
# # pattern = "nginx"
# ## user as argument for pgrep (ie, pgrep -u <user>)
# # user = "nginx"
#
# ## override for process_name
# ## This is optional; default is sourced from /proc/<pid>/status
# # process_name = "bar"
# ## Field name prefix
# prefix = ""
# ## comment this out if you want raw cpu_time stats
# fielddrop = ["cpu_time_*"]
# ## This is optional; moves pid into a tag instead of a field
# pid_tag = false
# # Read metrics from one or many prometheus clients
# [[inputs.prometheus]]
# ## An array of urls to scrape metrics from.
# urls = ["http://localhost:9100/metrics"]
#
# ## Use bearer token for authorization
# # bearer_token = /path/to/bearer/token
#
# ## Specify timeout duration for slower prometheus clients (default is 3s)
# # response_timeout = "3s"
#
# ## Optional SSL Config
# # ssl_ca = /path/to/cafile
# # ssl_cert = /path/to/certfile
# # ssl_key = /path/to/keyfile
# ## Use SSL but skip chain & host verification
# # insecure_skip_verify = false
# # Reads last_run_summary.yaml file and converts to measurments
# [[inputs.puppetagent]]
# ## Location of puppet last run summary file
# location = "/var/lib/puppet/state/last_run_summary.yaml"
# # Reads metrics from RabbitMQ servers via the Management Plugin
# [[inputs.rabbitmq]]
# ## Management Plugin url. (default: http://localhost:15672)
# # url = "http://localhost:15672"
# ## Tag added to rabbitmq_overview series; deprecated: use tags
# # name = "rmq-server-1"
# ## Credentials
# # username = "guest"
# # password = "guest"
#
# ## Optional SSL Config
# # ssl_ca = "/etc/telegraf/ca.pem"
# # ssl_cert = "/etc/telegraf/cert.pem"
# # ssl_key = "/etc/telegraf/key.pem"
# ## Use SSL but skip chain & host verification
# # insecure_skip_verify = false
#
# ## Optional request timeouts
# ##
# ## ResponseHeaderTimeout, if non-zero, specifies the amount of time to wait
# ## for a server's response headers after fully writing the request.
# # header_timeout = "3s"
# ##
# ## client_timeout specifies a time limit for requests made by this client.
# ## Includes connection time, any redirects, and reading the response body.
# # client_timeout = "4s"
#
# ## A list of nodes to gather as the rabbitmq_node measurement. If not
# ## specified, metrics for all nodes are gathered.
# # nodes = ["rabbit@node1", "rabbit@node2"]
#
# ## A list of queues to gather as the rabbitmq_queue measurement. If not
# ## specified, metrics for all queues are gathered.
# # queues = ["telegraf"]
# # Read raindrops stats (raindrops - real-time stats for preforking Rack servers)
# [[inputs.raindrops]]
# ## An array of raindrops middleware URI to gather stats.
# urls = ["http://localhost:8080/_raindrops"]
# # Read metrics from one or many redis servers
# [[inputs.redis]]
# ## specify servers via a url matching:
# ## [protocol://][:password]@address[:port]
# ## e.g.
# ## tcp://localhost:6379
# ## tcp://:password@192.168.99.100
# ## unix:///var/run/redis.sock
# ##
# ## If no servers are specified, then localhost is used as the host.
# ## If no port is specified, 6379 is used
# servers = ["tcp://localhost:6379"]
# # Read metrics from one or many RethinkDB servers
# [[inputs.rethinkdb]]
# ## An array of URI to gather stats about. Specify an ip or hostname
# ## with optional port add password. ie,
# ## rethinkdb://user:auth_key@10.10.3.30:28105,
# ## rethinkdb://10.10.3.33:18832,
# ## 10.0.0.1:10000, etc.
# servers = ["127.0.0.1:28015"]
# ##
# ## If you use actual rethinkdb of > 2.3.0 with username/password authorization,
# ## protocol have to be named "rethinkdb2" - it will use 1_0 H.
# # servers = ["rethinkdb2://username:password@127.0.0.1:28015"]
# ##
# ## If you use older versions of rethinkdb (<2.2) with auth_key, protocol
# ## have to be named "rethinkdb".
# # servers = ["rethinkdb://username:auth_key@127.0.0.1:28015"]
# # Read metrics one or many Riak servers
# [[inputs.riak]]
# # Specify a list of one or more riak http servers
# servers = ["http://localhost:8098"]
# # Read API usage and limits for a Salesforce organisation
# [[inputs.salesforce]]
# ## specify your credentials
# ##
# username = "your_username"
# password = "your_password"
# ##
# ## (optional) security token
# # security_token = "your_security_token"
# ##
# ## (optional) environment type (sandbox or production)
# ## default is: production
# ##
# # environment = "production"
# ##
# ## (optional) API version (default: "39.0")
# ##
# # version = "39.0"
# # Monitor sensors, requires lm-sensors package
# [[inputs.sensors]]
# ## Remove numbers from field names.
# ## If true, a field name like 'temp1_input' will be changed to 'temp_input'.
# # remove_numbers = true
# # Retrieves SNMP values from remote agents
# [[inputs.snmp]]
# agents = [ "127.0.0.1:161" ]
# ## Timeout for each SNMP query.
# timeout = "5s"
# ## Number of retries to attempt within timeout.
# retries = 3
# ## SNMP version, values can be 1, 2, or 3
# version = 2
#
# ## SNMP community string.
# community = "public"
#
# ## The GETBULK max-repetitions parameter
# max_repetitions = 10
#
# ## SNMPv3 auth parameters
# #sec_name = "myuser"
# #auth_protocol = "md5" # Values: "MD5", "SHA", ""
# #auth_password = "pass"
# #sec_level = "authNoPriv" # Values: "noAuthNoPriv", "authNoPriv", "authPriv"
# #context_name = ""
# #priv_protocol = "" # Values: "DES", "AES", ""
# #priv_password = ""
#
# ## measurement name
# name = "system"
# [[inputs.snmp.field]]
# name = "hostname"
# oid = ".1.0.0.1.1"
# [[inputs.snmp.field]]
# name = "uptime"
# oid = ".1.0.0.1.2"
# [[inputs.snmp.field]]
# name = "load"
# oid = ".1.0.0.1.3"
# [[inputs.snmp.field]]
# oid = "HOST-RESOURCES-MIB::hrMemorySize"
#
# [[inputs.snmp.table]]
# ## measurement name
# name = "remote_servers"
# inherit_tags = [ "hostname" ]
# [[inputs.snmp.table.field]]
# name = "server"
# oid = ".1.0.0.0.1.0"
# is_tag = true
# [[inputs.snmp.table.field]]
# name = "connections"
# oid = ".1.0.0.0.1.1"
# [[inputs.snmp.table.field]]
# name = "latency"
# oid = ".1.0.0.0.1.2"
#
# [[inputs.snmp.table]]
# ## auto populate table's fields using the MIB
# oid = "HOST-RESOURCES-MIB::hrNetworkTable"
# # DEPRECATED! PLEASE USE inputs.snmp INSTEAD.
# [[inputs.snmp_legacy]]
# ## Use 'oids.txt' file to translate oids to names
# ## To generate 'oids.txt' you need to run:
# ## snmptranslate -m all -Tz -On | sed -e 's/"//g' > /tmp/oids.txt
# ## Or if you have an other MIB folder with custom MIBs
# ## snmptranslate -M /mycustommibfolder -Tz -On -m all | sed -e 's/"//g' > oids.txt
# snmptranslate_file = "/tmp/oids.txt"
# [[inputs.snmp.host]]
# address = "192.168.2.2:161"
# # SNMP community
# community = "public" # default public
# # SNMP version (1, 2 or 3)
# # Version 3 not supported yet
# version = 2 # default 2
# # SNMP response timeout
# timeout = 2.0 # default 2.0
# # SNMP request retries
# retries = 2 # default 2
# # Which get/bulk do you want to collect for this host
# collect = ["mybulk", "sysservices", "sysdescr"]
# # Simple list of OIDs to get, in addition to "collect"
# get_oids = []
#
# [[inputs.snmp.host]]
# address = "192.168.2.3:161"
# community = "public"
# version = 2
# timeout = 2.0
# retries = 2
# collect = ["mybulk"]
# get_oids = [
# "ifNumber",
# ".1.3.6.1.2.1.1.3.0",
# ]
#
# [[inputs.snmp.get]]
# name = "ifnumber"
# oid = "ifNumber"
#
# [[inputs.snmp.get]]
# name = "interface_speed"
# oid = "ifSpeed"
# instance = "0"
#
# [[inputs.snmp.get]]
# name = "sysuptime"
# oid = ".1.3.6.1.2.1.1.3.0"
# unit = "second"
#
# [[inputs.snmp.bulk]]
# name = "mybulk"
# max_repetition = 127
# oid = ".1.3.6.1.2.1.1"
#
# [[inputs.snmp.bulk]]
# name = "ifoutoctets"
# max_repetition = 127
# oid = "ifOutOctets"
#
# [[inputs.snmp.host]]
# address = "192.168.2.13:161"
# #address = "127.0.0.1:161"
# community = "public"
# version = 2
# timeout = 2.0
# retries = 2
# #collect = ["mybulk", "sysservices", "sysdescr", "systype"]
# collect = ["sysuptime" ]
# [[inputs.snmp.host.table]]
# name = "iftable3"
# include_instances = ["enp5s0", "eth1"]
#
# # SNMP TABLEs
# # table without mapping neither subtables
# [[inputs.snmp.table]]
# name = "iftable1"
# oid = ".1.3.6.1.2.1.31.1.1.1"
#
# # table without mapping but with subtables
# [[inputs.snmp.table]]
# name = "iftable2"
# oid = ".1.3.6.1.2.1.31.1.1.1"
# sub_tables = [".1.3.6.1.2.1.2.2.1.13"]
#
# # table with mapping but without subtables
# [[inputs.snmp.table]]
# name = "iftable3"
# oid = ".1.3.6.1.2.1.31.1.1.1"
# # if empty. get all instances
# mapping_table = ".1.3.6.1.2.1.31.1.1.1.1"
# # if empty, get all subtables
#
# # table with both mapping and subtables
# [[inputs.snmp.table]]
# name = "iftable4"
# oid = ".1.3.6.1.2.1.31.1.1.1"
# # if empty get all instances
# mapping_table = ".1.3.6.1.2.1.31.1.1.1.1"
# # if empty get all subtables
# # sub_tables could be not "real subtables"
# sub_tables=[".1.3.6.1.2.1.2.2.1.13", "bytes_recv", "bytes_send"]
# # Read metrics from Microsoft SQL Server
# [[inputs.sqlserver]]
# ## Specify instances to monitor with a list of connection strings.
# ## All connection parameters are optional.
# ## By default, the host is localhost, listening on default port, TCP 1433.
# ## for Windows, the user is the currently running AD user (SSO).
# ## See https://github.com/denisenkom/go-mssqldb for detailed connection
# ## parameters.
# # servers = [
# # "Server=192.168.1.10;Port=1433;User Id=<user>;Password=<pw>;app name=telegraf;log=1;",
# # ]
# # Sysstat metrics collector
# [[inputs.sysstat]]
# ## Path to the sadc command.
# #
# ## Common Defaults:
# ## Debian/Ubuntu: /usr/lib/sysstat/sadc
# ## Arch: /usr/lib/sa/sadc
# ## RHEL/CentOS: /usr/lib64/sa/sadc
# sadc_path = "/usr/lib/sa/sadc" # required
# #
# #
# ## Path to the sadf command, if it is not in PATH
# # sadf_path = "/usr/bin/sadf"
# #
# #
# ## Activities is a list of activities, that are passed as argument to the
# ## sadc collector utility (e.g: DISK, SNMP etc...)
# ## The more activities that are added, the more data is collected.
# # activities = ["DISK"]
# #
# #
# ## Group metrics to measurements.
# ##
# ## If group is false each metric will be prefixed with a description
# ## and represents itself a measurement.
# ##
# ## If Group is true, corresponding metrics are grouped to a single measurement.
# # group = true
# #
# #
# ## Options for the sadf command. The values on the left represent the sadf
# ## options and the values on the right their description (wich are used for
# ## grouping and prefixing metrics).
# ##
# ## Run 'sar -h' or 'man sar' to find out the supported options for your
# ## sysstat version.
# [inputs.sysstat.options]
# -C = "cpu"
# -B = "paging"
# -b = "io"
# -d = "disk" # requires DISK activity
# "-n ALL" = "network"
# "-P ALL" = "per_cpu"
# -q = "queue"
# -R = "mem"
# -r = "mem_util"
# -S = "swap_util"
# -u = "cpu_util"
# -v = "inode"
# -W = "swap"
# -w = "task"
# # -H = "hugepages" # only available for newer linux distributions
# # "-I ALL" = "interrupts" # requires INT activity
# #
# #
# ## Device tags can be used to add additional tags for devices.
# ## For example the configuration below adds a tag vg with value rootvg for
# ## all metrics with sda devices.
# # [[inputs.sysstat.device_tags.sda]]
# # vg = "rootvg"
# # Gather metrics from the Tomcat server status page.
# [[inputs.tomcat]]
# ## URL of the Tomcat server status
# # url = "http://127.0.0.1:8080/manager/status/all?XML=true"
#
# ## HTTP Basic Auth Credentials
# # username = "tomcat"
# # password = "s3cret"
#
# ## Request timeout
# # timeout = "5s"
#
# ## Optional SSL Config
# # ssl_ca = "/etc/telegraf/ca.pem"
# # ssl_cert = "/etc/telegraf/cert.pem"
# # ssl_key = "/etc/telegraf/key.pem"
# ## Use SSL but skip chain & host verification
# # insecure_skip_verify = false
# # Inserts sine and cosine waves for demonstration purposes
# [[inputs.trig]]
# ## Set the amplitude
# amplitude = 10.0
# # Read Twemproxy stats data
# [[inputs.twemproxy]]
# ## Twemproxy stats address and port (no scheme)
# addr = "localhost:22222"
# ## Monitor pool name
# pools = ["redis_pool", "mc_pool"]
# # A plugin to collect stats from Varnish HTTP Cache
# [[inputs.varnish]]
# ## If running as a restricted user you can prepend sudo for additional access:
# #use_sudo = false
#
# ## The default location of the varnishstat binary can be overridden with:
# binary = "/usr/bin/varnishstat"
#
# ## By default, telegraf gather stats for 3 metric points.
# ## Setting stats will override the defaults shown below.
# ## Glob matching can be used, ie, stats = ["MAIN.*"]
# ## stats may also be set to ["*"], which will collect all stats
# stats = ["MAIN.cache_hit", "MAIN.cache_miss", "MAIN.uptime"]
# # Read metrics of ZFS from arcstats, zfetchstats, vdev_cache_stats, and pools
# [[inputs.zfs]]
# ## ZFS kstat path. Ignored on FreeBSD
# ## If not specified, then default is:
# # kstatPath = "/proc/spl/kstat/zfs"
#
# ## By default, telegraf gather all zfs stats
# ## If not specified, then default is:
# # kstatMetrics = ["arcstats", "zfetchstats", "vdev_cache_stats"]
#
# ## By default, don't gather zpool stats
# # poolMetrics = false
# # Reads 'mntr' stats from one or many zookeeper servers
# [[inputs.zookeeper]]
# ## An array of address to gather stats about. Specify an ip or hostname
# ## with port. ie localhost:2181, 10.0.0.1:2181, etc.
#
# ## If no servers are specified, then localhost is used as the host.
# ## If no port is specified, 2181 is used
# servers = [":2181"]
###############################################################################
# SERVICE INPUT PLUGINS #
###############################################################################
# # AMQP consumer plugin
# [[inputs.amqp_consumer]]
# ## AMQP url
# url = "amqp://localhost:5672/influxdb"
# ## AMQP exchange
# exchange = "telegraf"
# ## AMQP queue name
# queue = "telegraf"
# ## Binding Key
# binding_key = "#"
#
# ## Maximum number of messages server should give to the worker.
# prefetch_count = 50
#
# ## Auth method. PLAIN and EXTERNAL are supported
# ## Using EXTERNAL requires enabling the rabbitmq_auth_mechanism_ssl plugin as
# ## described here: https://www.rabbitmq.com/plugins.html
# # auth_method = "PLAIN"
#
# ## Optional SSL Config
# # ssl_ca = "/etc/telegraf/ca.pem"
# # ssl_cert = "/etc/telegraf/cert.pem"
# # ssl_key = "/etc/telegraf/key.pem"
# ## Use SSL but skip chain & host verification
# # insecure_skip_verify = false
#
# ## Data format to output.
# ## Each data format has its own unique set of configuration options, read
# ## more about them here:
# ## https://github.com/influxdata/telegraf/blob/master/docs/DATA_FORMATS_OUTPUT.md
# data_format = "influx"
# # Influx HTTP write listener
# [[inputs.http_listener]]
# ## Address and port to host HTTP listener on
# service_address = ":8186"
#
# ## maximum duration before timing out read of the request
# read_timeout = "10s"
# ## maximum duration before timing out write of the response
# write_timeout = "10s"
#
# ## Maximum allowed http request body size in bytes.
# ## 0 means to use the default of 536,870,912 bytes (500 mebibytes)
# max_body_size = 0
#
# ## Maximum line size allowed to be sent in bytes.
# ## 0 means to use the default of 65536 bytes (64 kibibytes)
# max_line_size = 0
# # Read metrics from Kafka topic(s)
# [[inputs.kafka_consumer]]
# ## kafka servers
# brokers = ["localhost:9092"]
# ## topic(s) to consume
# topics = ["telegraf"]
#
# ## Optional SSL Config
# # ssl_ca = "/etc/telegraf/ca.pem"
# # ssl_cert = "/etc/telegraf/cert.pem"
# # ssl_key = "/etc/telegraf/key.pem"
# ## Use SSL but skip chain & host verification
# # insecure_skip_verify = false
#
# ## Optional SASL Config
# # sasl_username = "kafka"
# # sasl_password = "secret"
#
# ## the name of the consumer group
# consumer_group = "telegraf_metrics_consumers"
# ## Offset (must be either "oldest" or "newest")
# offset = "oldest"
#
# ## Data format to consume.
# ## Each data format has its own unique set of configuration options, read
# ## more about them here:
# ## https://github.com/influxdata/telegraf/blob/master/docs/DATA_FORMATS_INPUT.md
# data_format = "influx"
#
# ## Maximum length of a message to consume, in bytes (default 0/unlimited);
# ## larger messages are dropped
# max_message_len = 65536
# # Read metrics from Kafka topic(s)
# [[inputs.kafka_consumer_legacy]]
# ## topic(s) to consume
# topics = ["telegraf"]
# ## an array of Zookeeper connection strings
# zookeeper_peers = ["localhost:2181"]
# ## Zookeeper Chroot
# zookeeper_chroot = ""
# ## the name of the consumer group
# consumer_group = "telegraf_metrics_consumers"
# ## Offset (must be either "oldest" or "newest")
# offset = "oldest"
#
# ## Data format to consume.
# ## Each data format has its own unique set of configuration options, read
# ## more about them here:
# ## https://github.com/influxdata/telegraf/blob/master/docs/DATA_FORMATS_INPUT.md
# data_format = "influx"
#
# ## Maximum length of a message to consume, in bytes (default 0/unlimited);
# ## larger messages are dropped
# max_message_len = 65536
# # Stream and parse log file(s).
# [[inputs.logparser]]
# ## Log files to parse.
# ## These accept standard unix glob matching rules, but with the addition of
# ## ** as a "super asterisk". ie:
# ## /var/log/**.log -> recursively find all .log files in /var/log
# ## /var/log/*/*.log -> find all .log files with a parent dir in /var/log
# ## /var/log/apache.log -> only tail the apache log file
# files = ["/var/log/apache/access.log"]
#
# ## Read files that currently exist from the beginning. Files that are created
# ## while telegraf is running (and that match the "files" globs) will always
# ## be read from the beginning.
# from_beginning = false
#
# ## Parse logstash-style "grok" patterns:
# ## Telegraf built-in parsing patterns: https://goo.gl/dkay10
# [inputs.logparser.grok]
# ## This is a list of patterns to check the given log file(s) for.
# ## Note that adding patterns here increases processing time. The most
# ## efficient configuration is to have one pattern per logparser.
# ## Other common built-in patterns are:
# ## %{COMMON_LOG_FORMAT} (plain apache & nginx access logs)
# ## %{COMBINED_LOG_FORMAT} (access logs + referrer & agent)
# patterns = ["%{COMBINED_LOG_FORMAT}"]
#
# ## Name of the outputted measurement name.
# measurement = "apache_access_log"
#
# ## Full path(s) to custom pattern files.
# custom_pattern_files = []
#
# ## Custom patterns can also be defined here. Put one pattern per line.
# custom_patterns = '''
#
# ## Timezone allows you to provide an override for timestamps that
# ## don't already include an offset
# ## e.g. 04/06/2016 12:41:45 data one two 5.43µs
# ##
# ## Default: "" which renders UTC
# ## Options are as follows:
# ## 1. Local -- interpret based on machine localtime
# ## 2. "Canada/Eastern" -- Unix TZ values like those found in https://en.wikipedia.org/wiki/List_of_tz_database_time_zones
# ## 3. UTC -- or blank/unspecified, will return timestamp in UTC
# timezone = "Canada/Eastern"
# '''
# # Read metrics from MQTT topic(s)
# [[inputs.mqtt_consumer]]
# servers = ["localhost:1883"]
# ## MQTT QoS, must be 0, 1, or 2
# qos = 0
#
# ## Topics to subscribe to
# topics = [
# "telegraf/host01/cpu",
# "telegraf/+/mem",
# "sensors/#",
# ]
#
# # if true, messages that can't be delivered while the subscriber is offline
# # will be delivered when it comes back (such as on service restart).
# # NOTE: if true, client_id MUST be set
# persistent_session = false
# # If empty, a random client ID will be generated.
# client_id = ""
#
# ## username and password to connect MQTT server.
# # username = "telegraf"
# # password = "metricsmetricsmetricsmetrics"
#
# ## Optional SSL Config
# # ssl_ca = "/etc/telegraf/ca.pem"
# # ssl_cert = "/etc/telegraf/cert.pem"
# # ssl_key = "/etc/telegraf/key.pem"
# ## Use SSL but skip chain & host verification
# # insecure_skip_verify = false
#
# ## Data format to consume.
# ## Each data format has its own unique set of configuration options, read
# ## more about them here:
# ## https://github.com/influxdata/telegraf/blob/master/docs/DATA_FORMATS_INPUT.md
# data_format = "influx"
# # Read metrics from NATS subject(s)
# [[inputs.nats_consumer]]
# ## urls of NATS servers
# # servers = ["nats://localhost:4222"]
# ## Use Transport Layer Security
# # secure = false
# ## subject(s) to consume
# # subjects = ["telegraf"]
# ## name a queue group
# # queue_group = "telegraf_consumers"
#
# ## Sets the limits for pending msgs and bytes for each subscription
# ## These shouldn't need to be adjusted except in very high throughput scenarios
# # pending_message_limit = 65536
# # pending_bytes_limit = 67108864
#
# ## Data format to consume.
# ## Each data format has its own unique set of configuration options, read
# ## more about them here:
# ## https://github.com/influxdata/telegraf/blob/master/docs/DATA_FORMATS_INPUT.md
# data_format = "influx"
# # Read NSQ topic for metrics.
# [[inputs.nsq_consumer]]
# ## An string representing the NSQD TCP Endpoint
# server = "localhost:4150"
# topic = "telegraf"
# channel = "consumer"
# max_in_flight = 100
#
# ## Data format to consume.
# ## Each data format has its own unique set of configuration options, read
# ## more about them here:
# ## https://github.com/influxdata/telegraf/blob/master/docs/DATA_FORMATS_INPUT.md
# data_format = "influx"
# # Generic socket listener capable of handling multiple socket types.
# [[inputs.socket_listener]]
# ## URL to listen on
# # service_address = "tcp://:8094"
# # service_address = "tcp://127.0.0.1:http"
# # service_address = "tcp4://:8094"
# # service_address = "tcp6://:8094"
# # service_address = "tcp6://[2001:db8::1]:8094"
# # service_address = "udp://:8094"
# # service_address = "udp4://:8094"
# # service_address = "udp6://:8094"
# # service_address = "unix:///tmp/telegraf.sock"
# # service_address = "unixgram:///tmp/telegraf.sock"
#
# ## Maximum number of concurrent connections.
# ## Only applies to stream sockets (e.g. TCP).
# ## 0 (default) is unlimited.
# # max_connections = 1024
#
# ## Read timeout.
# ## Only applies to stream sockets (e.g. TCP).
# ## 0 (default) is unlimited.
# # read_timeout = "30s"
#
# ## Maximum socket buffer size in bytes.
# ## For stream sockets, once the buffer fills up, the sender will start backing up.
# ## For datagram sockets, once the buffer fills up, metrics will start dropping.
# ## Defaults to the OS default.
# # read_buffer_size = 65535
#
# ## Period between keep alive probes.
# ## Only applies to TCP sockets.
# ## 0 disables keep alive probes.
# ## Defaults to the OS configuration.
# # keep_alive_period = "5m"
#
# ## Data format to consume.
# ## Each data format has its own unique set of configuration options, read
# ## more about them here:
# ## https://github.com/influxdata/telegraf/blob/master/docs/DATA_FORMATS_INPUT.md
# # data_format = "influx"
# # Statsd UDP/TCP Server
# [[inputs.statsd]]
# ## Protocol, must be "tcp" or "udp" (default=udp)
# protocol = "udp"
#
# ## MaxTCPConnection - applicable when protocol is set to tcp (default=250)
# max_tcp_connections = 250
#
# ## Address and port to host UDP listener on
# service_address = ":8125"
#
# ## The following configuration options control when telegraf clears it's cache
# ## of previous values. If set to false, then telegraf will only clear it's
# ## cache when the daemon is restarted.
# ## Reset gauges every interval (default=true)
# delete_gauges = true
# ## Reset counters every interval (default=true)
# delete_counters = true
# ## Reset sets every interval (default=true)
# delete_sets = true
# ## Reset timings & histograms every interval (default=true)
# delete_timings = true
#
# ## Percentiles to calculate for timing & histogram stats
# percentiles = [90]
#
# ## separator to use between elements of a statsd metric
# metric_separator = "_"
#
# ## Parses tags in the datadog statsd format
# ## http://docs.datadoghq.com/guides/dogstatsd/
# parse_data_dog_tags = false
#
# ## Statsd data translation templates, more info can be read here:
# ## https://github.com/influxdata/telegraf/blob/master/docs/DATA_FORMATS_INPUT.md#graphite
# # templates = [
# # "cpu.* measurement*"
# # ]
#
# ## Number of UDP messages allowed to queue up, once filled,
# ## the statsd server will start dropping packets
# allowed_pending_messages = 10000
#
# ## Number of timing/histogram values to track per-measurement in the
# ## calculation of percentiles. Raising this limit increases the accuracy
# ## of percentiles but also increases the memory usage and cpu time.
# percentile_limit = 1000
# # Stream a log file, like the tail -f command
# [[inputs.tail]]
# ## files to tail.
# ## These accept standard unix glob matching rules, but with the addition of
# ## ** as a "super asterisk". ie:
# ## "/var/log/**.log" -> recursively find all .log files in /var/log
# ## "/var/log/*/*.log" -> find all .log files with a parent dir in /var/log
# ## "/var/log/apache.log" -> just tail the apache log file
# ##
# ## See https://github.com/gobwas/glob for more examples
# ##
# files = ["/var/mymetrics.out"]
# ## Read file from beginning.
# from_beginning = false
# ## Whether file is a named pipe
# pipe = false
#
# ## Data format to consume.
# ## Each data format has its own unique set of configuration options, read
# ## more about them here:
# ## https://github.com/influxdata/telegraf/blob/master/docs/DATA_FORMATS_INPUT.md
# data_format = "influx"
# # Generic TCP listener
# [[inputs.tcp_listener]]
# # DEPRECATED: the TCP listener plugin has been deprecated in favor of the
# # socket_listener plugin
# # see https://github.com/influxdata/telegraf/tree/master/plugins/inputs/socket_listener
# # Generic UDP listener
# [[inputs.udp_listener]]
# # DEPRECATED: the TCP listener plugin has been deprecated in favor of the
# # socket_listener plugin
# # see https://github.com/influxdata/telegraf/tree/master/plugins/inputs/socket_listener
# # A Webhooks Event collector
# [[inputs.webhooks]]
# ## Address and port to host Webhook listener on
# service_address = ":1619"
#
# [inputs.webhooks.filestack]
# path = "/filestack"
#
# [inputs.webhooks.github]
# path = "/github"
# # secret = ""
#
# [inputs.webhooks.mandrill]
# path = "/mandrill"
#
# [inputs.webhooks.rollbar]
# path = "/rollbar"
#
# [inputs.webhooks.papertrail]
# path = "/papertrail"
# # This plugin implements the Zipkin http server to gather trace and timing data needed to troubleshoot latency problems in microservice architectures.
# [[inputs.zipkin]]
# # path = "/api/v1/spans" # URL path for span data
# # port = 9411 # Port on which Telegraf listens
# For details see:
# * http://wiki.apache.org/cassandra/Metrics
# * https://github.com/addthis/metrics-reporter-config

# This is an example file for configuring which metrics should go
# where.  The sample sends everything to a flat file for humans to
# poke at.  metrics-ganglia or metrics-graphite are more likely to
# operationally useful.

# Some metrics are global for a node (KeyCache capacity) while others
# are broken down by column family or even IP.  The sample list
# includes all of the global metrics via a while list.  To include
# metrics for the system column family for example add
# "^org.apache.cassandra.metrics.ColumnFamily.system.+".


# Start Cassandra with
# -Dcassandra.metricsReporterConfigFile=metrics-reporter-config.yaml
# for this file to be used.  If you are using metrics-ganglia,
# metrics-graphite, or a custom reporter you will also have to add those
# jars to the lib directory.  Nothing in this file can affect
# jmx metrics.


graphite:
  -
    period: 30
    timeunit: 'SECONDS'
    prefix: 'HOST_NAME'
    hosts:
     - host: 'IP'
       port: 2003
    predicate:
      color: 'white'
      useQualifiedName: true
      patterns:
        - '^org.apache.cassandra.+'
        - '^jvm.+'
#!/bin/bash
echo "=========================================="
echo "Monitor additional TWC node     "
echo "=========================================="
read -e -p "Please enter the hostname of the Teamwork Cloud Node (as obtained via the hostname command):  "  -i ""  HOSTNAME
echo ""
read -e -p "Please enter the IP Address of the Teamwork Cloud Node:  "  -i ""  IPADDRESS
echo ""
JMXFILE=twcloud-$HOSTNAME.json
sudo sed -e "s/HOST_NAME/$HOSTNAME/g" twcloud.json.template > $JMXFILE
sudo sed -i "s/IP_ADDRESS/$IPADDRESS/g" $JMXFILE
sudo chmod 755 $JMXFILE
sudo \cp -fR $JMXFILE /var/lib/jmxtrans/
sudo systemctl restart jmxtrans
Importing the Teamwork Cloud Dashboard into Grafana
- Log in to the Grafana dashboard (http://MONITORINGNODE_IP:3000). Default credentials are admin/admin. Upon logging in, you will be prompted to change the admin password.
- You will be presented with the following screen:
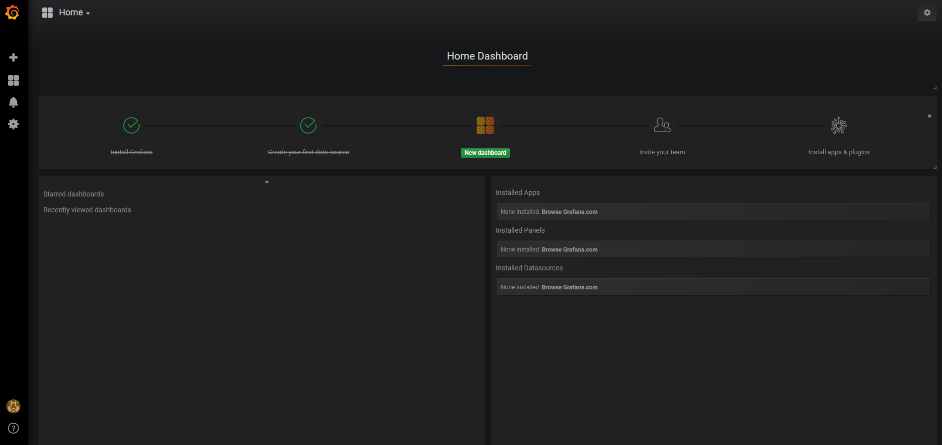
- Select the option to import a dashboard
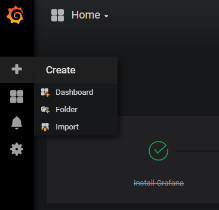
- To upload .json file, click the Upload .json File
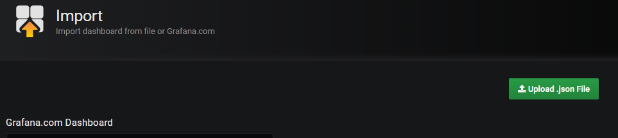
- Select the provided Teamwork_Cloud_Dashboard.json. At this point, you will be presented with the following screen, in which you will need to map the data sources
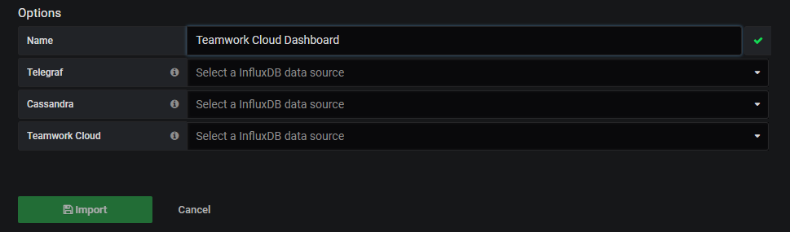
- Select the provided Teamwork_Cloud_Dashboard.json. At this point, you will be presented with the following screen, in which you will need to map the data sources
- Map the data sources as shown below and click the Import button

- To make the Teamwork Cloud dashboard your home dashboard, perform the following steps:
- Mark the Teamwork Cloud Dashboard as a favorite

- Select Configuration -> Preferences
- Select the Teamwork Cloud Dashboard to be your Home Dashboard and click Save.
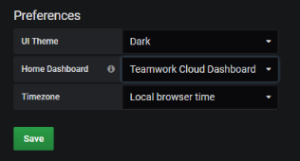
- Mark the Teamwork Cloud Dashboard as a favorite
The scripted process created a guest user, with credentials guest/guest, who can view the dashboard but cannot make any changes to it.
- No labels