
Released: February 12, 2021
Version 2021x adds the ability to use layers in diagrams, automatically create legends, present diagrams or predefined sequences of diagrams in full screen to stakeholders, create compositions and aggregations in matrices, and use predefined element type filters when searching for the necessary model elements. Additionally, the usage of Simulink import and Modelica export has been extended with few enhancements, the Excel/CSV file import functionality has been reviewed and refreshed, and numerous improvements to Excel/CSV synchronization functionality in tables have been added.
Few powerful simulation features will change the way you simulate your models by using diagrams as a simulation dashboard. For your convenience, streaming behavior simulation is now supported and simulation options have been moved to Project Options, animation-delay affects only visible diagrams to provide better user experience, guard evaluation on transitions expressed in natural language are now interactive, and more.
This release brings significant performance and scalability upgrades in key product areas: Merge, Teamwork Cloud project load, Teamwork Cloud project saving, table loading, Excel and CSV files import, and such common modeling tool operations as Copy/Paste, Find, Numbering, Element Selection, and Validation.
Last but not least, project merge has been extended to give users the option to show only the changes in directly modified diagrams, hide Target and Equivalent Changes by default, and choose a specific ancestor calculation algorithm depending on merge scenario and expected outcome.
Download the newest Cameo System Modeler version at nomagic.com or contact your sales representative. Don't forget to give us your feedback on LinkedIn, Twitter, or Facebook. For further information, please check the latest documentation.
Modeling and Infrastructure
Layers Based on Legends
Diagrams can get extremely crowded as a model evolves. For example, when highlighting a chosen piece of information, only one specific aspect of the system becomes a challenge. For your convenience, you can now filter diagrams by the selected Legend items to make only the necessary diagram layers stand out.
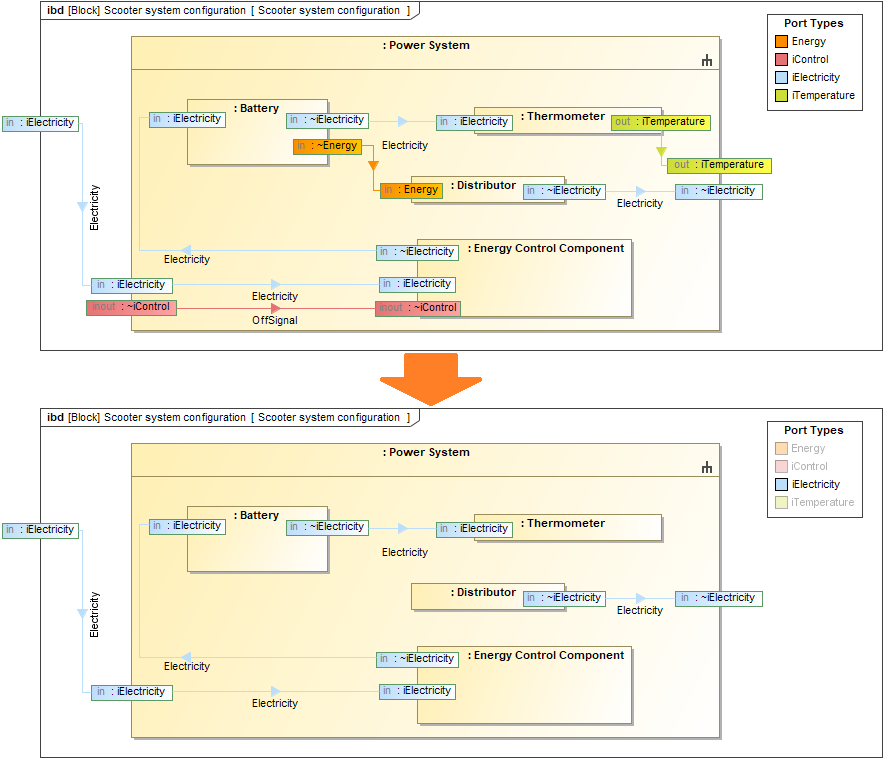
Filtering the diagram by the selected Legend item.
Learn more about layers based on Legends >>
Intelligent Legend Creation
Seems like Legend creation is a tiresome activity? Not at all! From now on, you can create Legends easier than ever before – extract them automatically from the elements displayed on your diagram instead of relying on a manual creation. What is more, you can now automatically extract Legend items for the existing Legends. Once the Legend items are created, you can customize their adornments representation. They can now be displayed as rectangular shapes or extended lines to represent paths and shapes in greater detail.
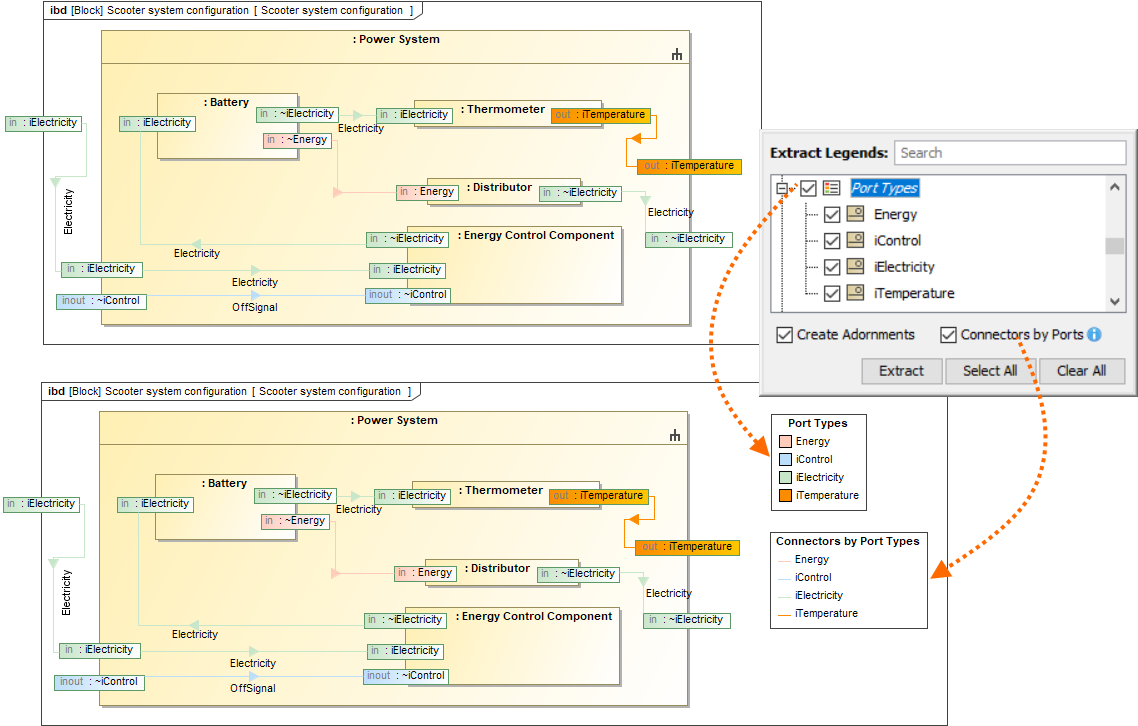
Extracting the Port Types legend according to the elements displayed on the diagram as symbols.
Presentation Mode
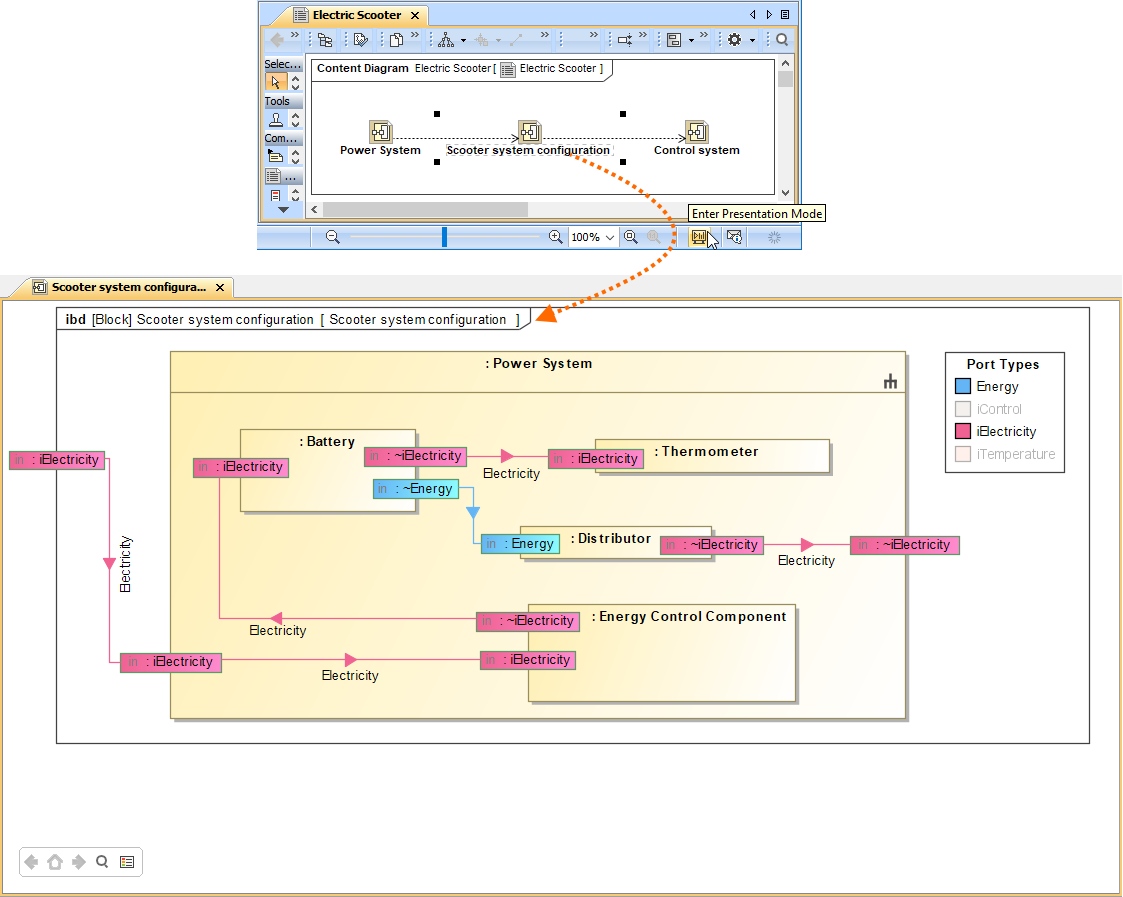
Direct the attention of your audience to the diagrams being presented! You can now present diagrams in full screen without showing such user interface components as model browser, diagram palette, status bar, and toolbars. That is not all! You can also define the sequence of diagrams to present one after another.
Renewed Excel/CSV File Import
You can import data from an Excel/CSV file directly to the model without installing Excel and CSV Import Plugins (read more about discontinued products). From now on, the newly created Excel/CSV Import dialog brings an easy to use and clearly understandable graphical user interface. It allows you to import content with just a few clicks by selecting the Excel/CSV file and specifying element mapping options. Additionally, you can save your maps to reuse them, collect saved maps in groups, manage those groups, and use an entire group instead of a single map for data import.
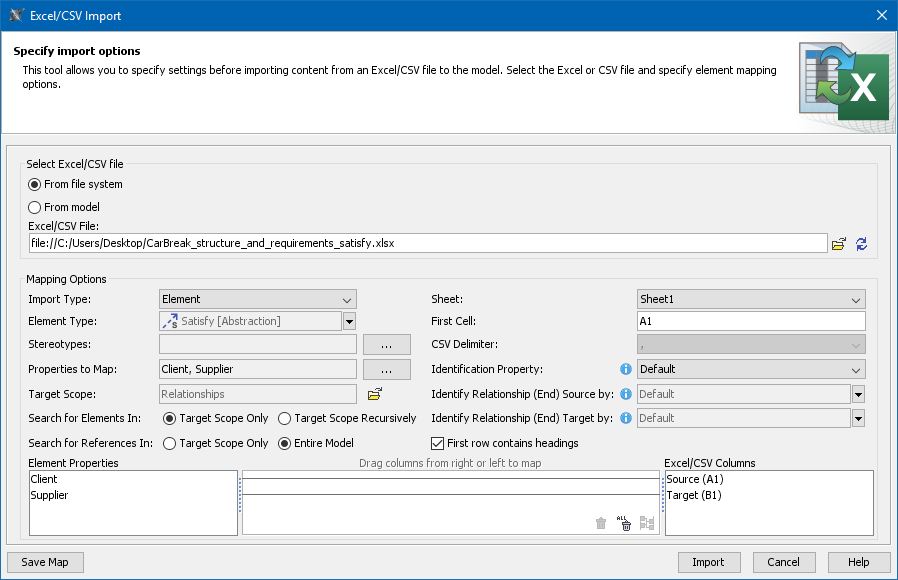
The Excel/CSV Import dialog with specified options for satisfy relationship import.
Learn more about Excel/CSV file import >>
Extended Excel and CSV Sync
Three improvements expanded the data synchronization between Excel or CSV files and a model:
- Unique elements. Elements to be synchronized can now be identified not only by their name, but also by element property or tag value.
- Direct relationships. From now on, you can import direct relationships between the source and target elements as easily as other elements.
- Relationship ends. When importing relationships between different elements, you can select a specific property or tag to identify the source and target end of the relationship.
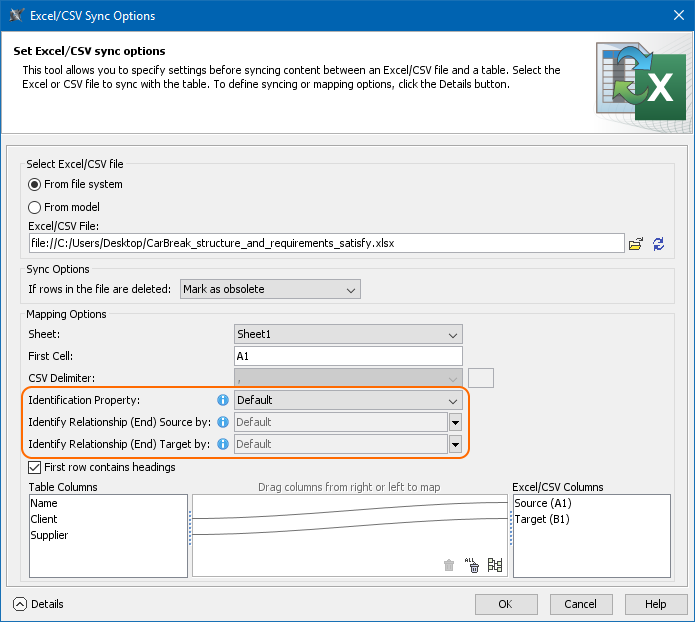
New mapping options in the Excel/CSV Sync Options dialog: Identification Property, Identify Relationship (end) Source by, Identify Relationship (end) Target by.
Learn more about Excel/CSV Sync in tables >>
Composition and Aggregation Relationships in Dependency Matrix
You can now define relationships between the elements in your model more accurately! The latest release gives you the ability to create and display Composition and Aggregation relationships in a Dependency Matrix.
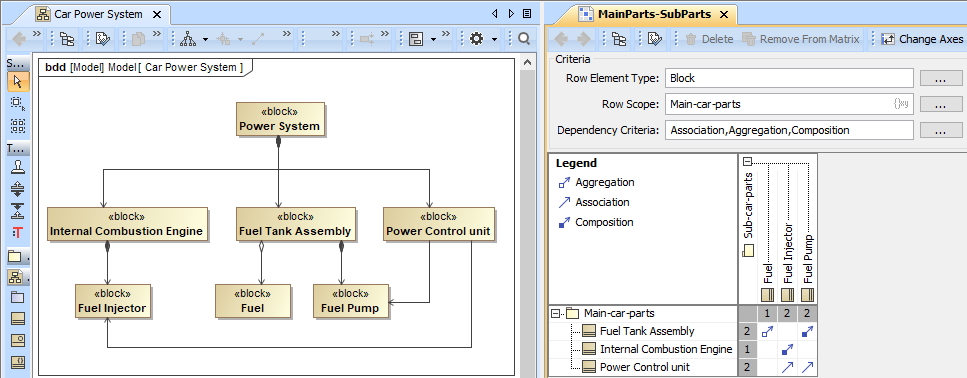
Creating and displaying Composition, Aggregation, and Association in a Dependency Matrix.
Learn more about Composition and Aggregation creation >>
Other Improvements
Applying Legend items to the same element is more convenient since they are now grouped by Legend.
A reference from the image shape to the attached image is now created when attached images are displayed as diagram shapes.
The Diagram Tabs Limit is set to 20 to prevent high memory utilization. You can change this environment option at any time.
The smart autocompletion command Ctrl + Space now works for the Change Event expression in a State Machine diagram.
In the Select Element and Quick Find dialogs, elements can now be filtered by their types to narrow down search results.
- The Jython 2.7.2 version is now supported.
- The MARTE Profile version 1.2 is now supported.
- The Reader Edition is now available for all the 2021x version modeling tools. Contact your sales executive to request the license.
Simulink and Modelica Integration Improvements
Proxy Ports in FMU and Simulink Import
FMU and Simulink import now support Proxy Port creation. Once you have imported the external FMU/Simulink model, you can select the Proxy Port to be created in your model and then specify an existing or create a new Interface Block to be used as its type.
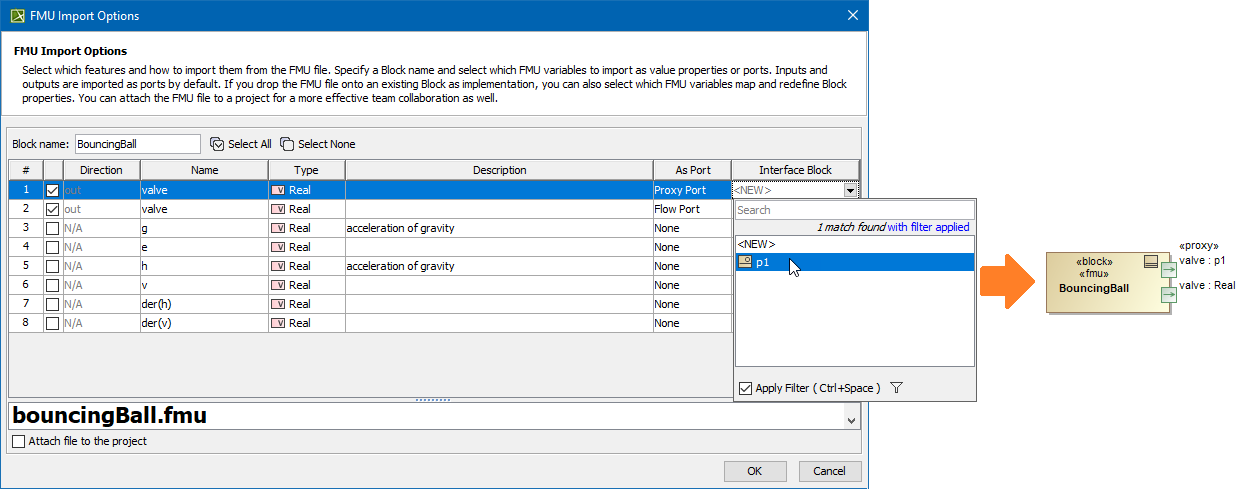 Selecting the Proxy Port and an Interface Block upon the external model import.
Learn more about FMU and Simulink import >>
Simulink Model Import to Activities
You can import the Simulink model by dragging and dropping the Simulink file (*.slx) directly onto the Activity diagram. The Activity (stereotyped by «SimulinkBlock») which is assigned as behavior for the Call Behavior Action and its Input and/or Output Pins are created in the model.
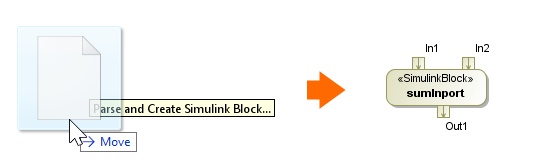
Simulink import to Activity diagram.
Learn more about Simulink import >>
Simulink Composite Signals export
You can now select how to export Proxy Port or Interface Block with multiple Flow Properties (composite signals): as bus Creators/Selectors or as bus In/Out ports.
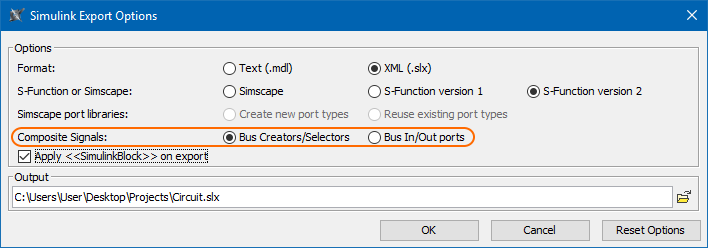
Learn more about Simulink export >>
IBD-based Selective Modelica Export
You can now use the Internal Block Diagram to select what to export to Modelica. Only parts, ports, and connectors appearing in this diagram are exported, rather than the entire model. See whole vs partial export comparison in the image below.
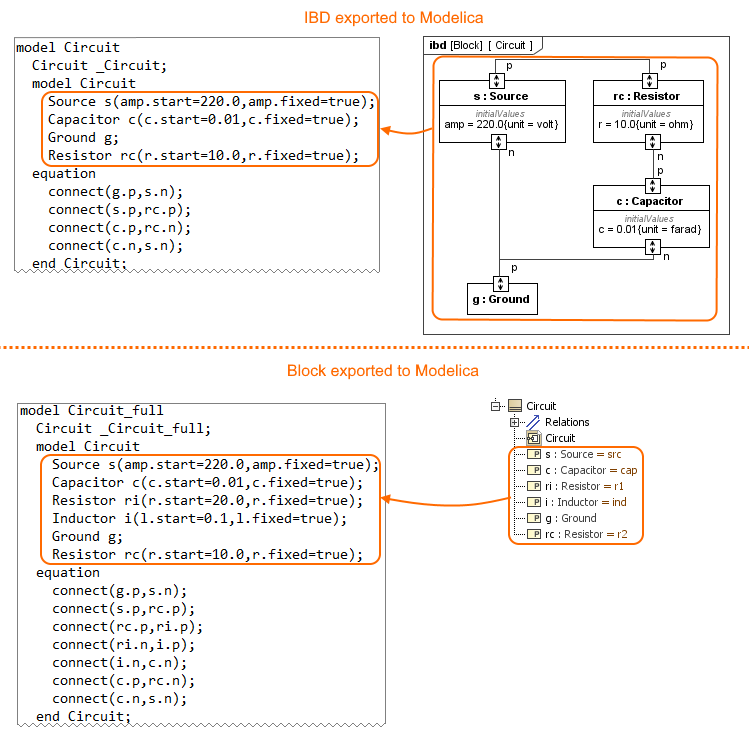
The difference between whole (exporting Block) and partial (exporting IBD) export to the Modelica file.
Learn more about Modelica export >>
SysML 1.6 Support
As of version 2021x the SysML Plugin supports the SysML 1.6 specification which brings the following improvements:
- One more way to model conjugated ports is to create the Conjugated Interface Block which has the same features as its original Interface Block except that its Directed Features and Flow Properties are reversed (conjugated). Learn more about Conjugated Interface Block >>
- The ability to change the Binding Connector notation keyword from "equal" to sign "=". Learn how to create Binding Connector >>
- The new stereotype «AddFlowPropertyValueOnNestedPortAction» is created which enables values added to a flow property to propagate out through a specified behavioral port of an object executing the action, rather than all behavior ports exposing the flow property. It also enables values added to a flow property to propagate into objects.
- The AdjunctProperty principal type is changed from Element to NamedElement.
- The «PropertySpecificType» stereotype is renamed to «pst».
- The Value Type compartment attributes is renamed to properties.
- The initialValue compartment is renamed to initial values.
- The signal receptions compartment is renamed to receptions.
- The FlowDirection, FeatureDirection and ControlValue enumerations are renamed to FlowDirectionKind, FeatureDirectionKind and ControlValueKind respectively.
Simulation
HTML Widgets in IBD Diagrams
Cameo Simulation Toolkit introduces a new powerful mechanism to integrate any third-party interactive HTML components (widgets) into SysML diagrams for simulation. A set of predefined widgets is available in UI Widgets Library. You can drag and drop widgets to IBD diagrams and connect them to appropriate value properties to provide inputs or read outputs. If you have basic HTML and JavaScript skills, you can manually create new custom widgets and integrate them into simulation.
Please note that the free Web Server for Cameo Simulation Tookit plugin is required for this functionality.
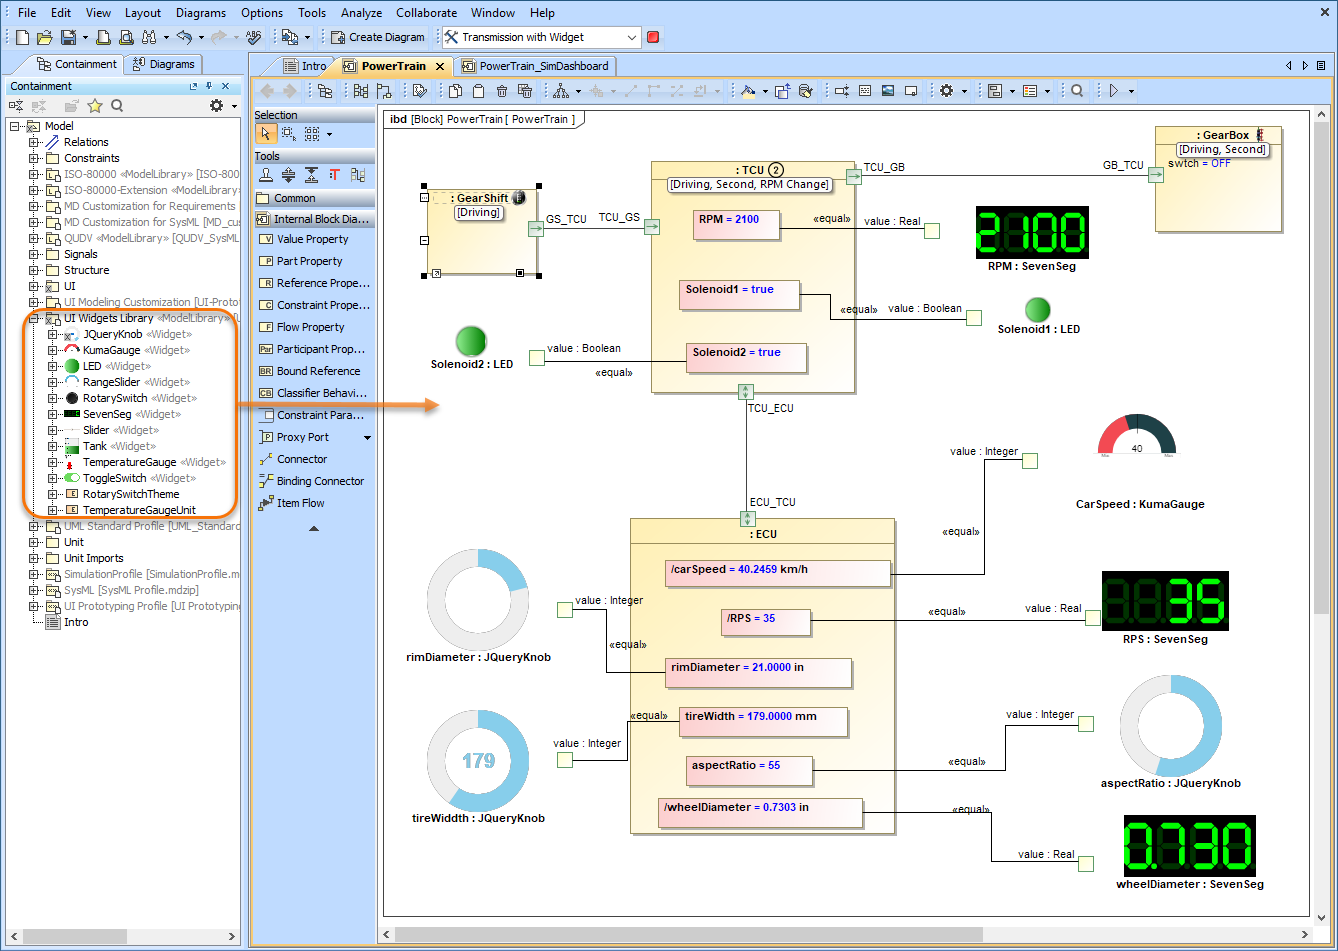
The example of using widgets from UI Widgets Library in an Internal Block Definition Diagram.
Learn more about integrating widgets for simulation >>
Streaming Activity Simulation
Cameo Simulation Toolkit 2021x supports the simulation of streaming activities when a system receives inputs and produces outputs even while behaviors continue to execute. As you can see in the example below, during simulation several actions can be executed simultaneously, and waiting tokens are displayed on action pins. Note that you can control the held token display in the Project Options dialog or Simulation Configuration properties.
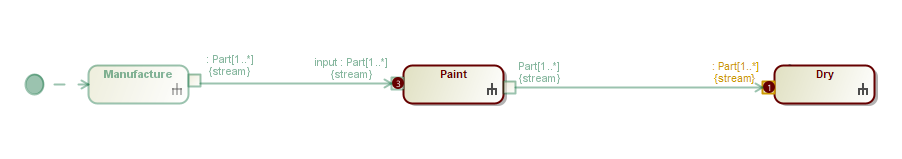
An example of a streaming Activity.
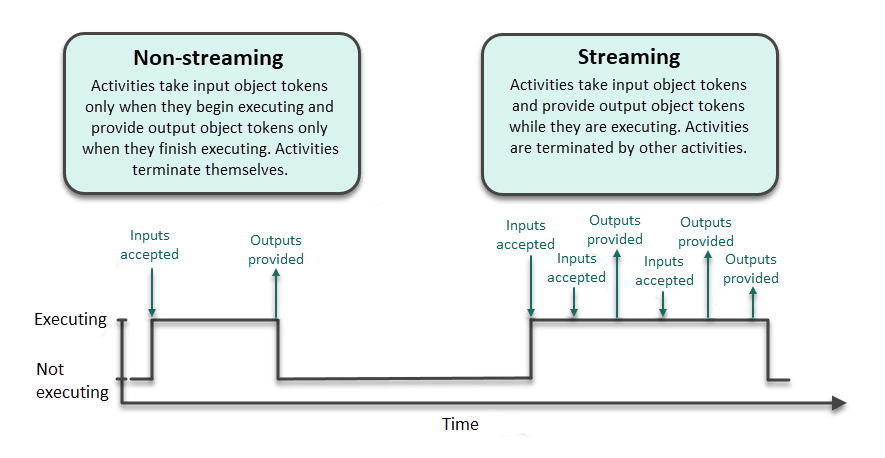
This diagram shows the differences between streaming and non-streaming behavior execution.
Learn more about streaming Activity simulation >>
Displaying and Changing Runtime Values in Diagrams
WIth Cameo Simulation Toolkit 20.0 monitoring and manipulating simulation information has never been easier. Now you can display runtime values of Parts in all diagrams based on a Composite Structure Diagram as shown in the figure below. But that is not all, you can also modify runtime values directly in a diagram the same way you do it in the Simulation window.
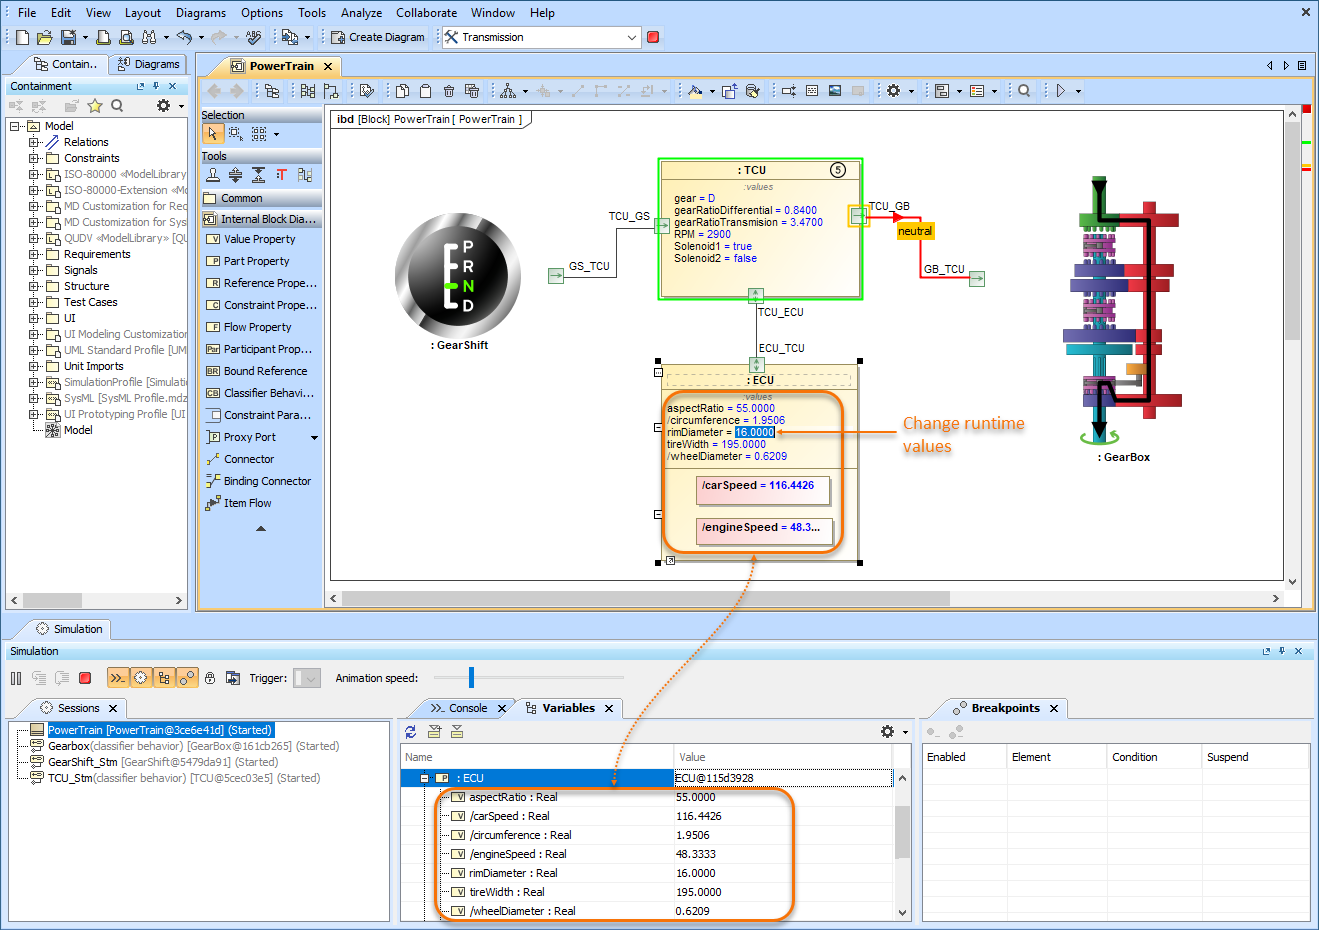
This sample model demonstrates how you can view and change runtime values of Parts directly in an Internal Block Definition Diagram.
Displaying Active State in Diagrams
Now diagrams based on a Composite Structure Diagram display the active States of Parts when simulating a model. Active states are shown on the bottom of Part shapes the same way they are displayed in the Variables pane of the Simulation window. This new feature improves the readability of simulation information because you no longer need the Simulation window to see how active States change when executing your model.
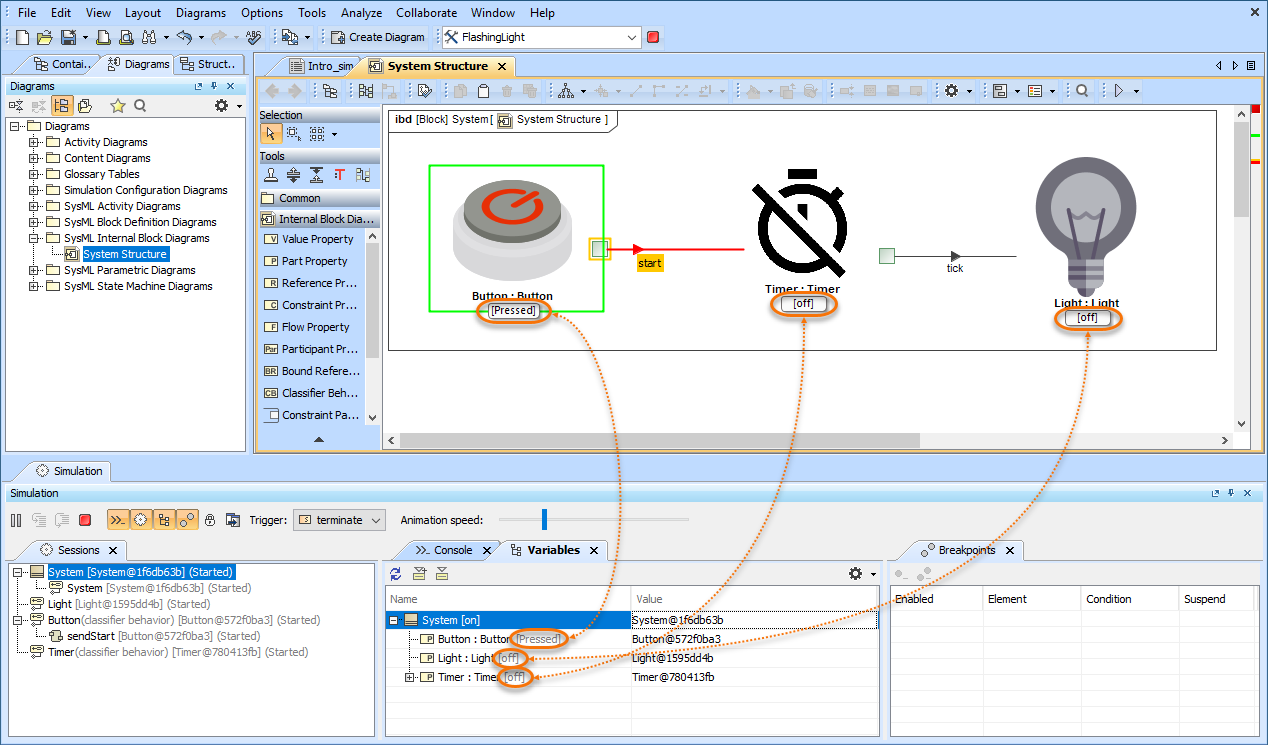
In this Internal Block Definition Diagram, you can see that active States are displayed both in the Simulation window and on the shapes of initialized Parts.
Displaying Active State Images
Make your model simulation look more illustrative and vivid by displaying active State images on Part shapes. You can do that by assigning an Image Switcher to the Simulation Configuration from which you execute your model or by applying an image to a State. When states change during simulation, state images change as well as displayed in the following figure.
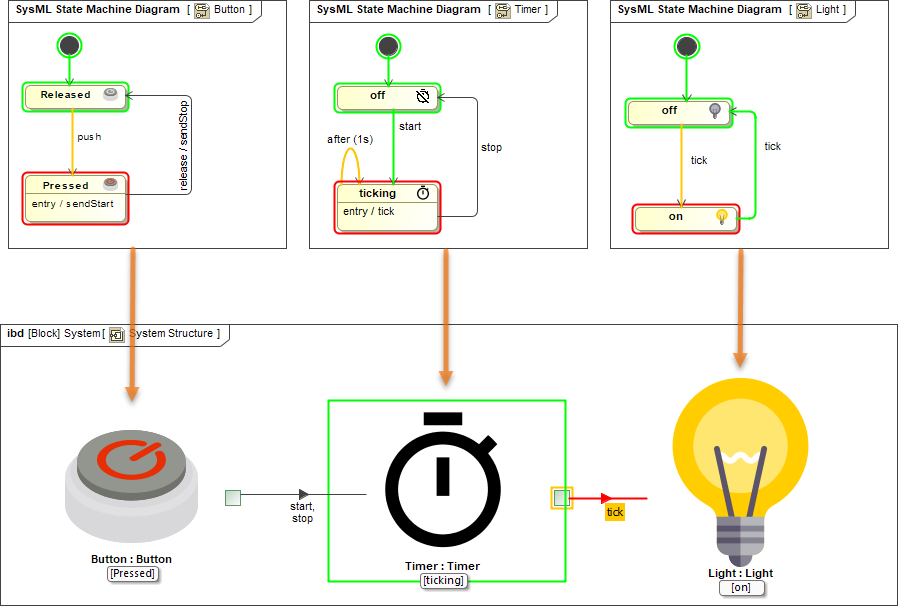
Here you can see how active State images are displayed when simulating a model.
Displaying Flowing Information
Cameo Simulation Toolkit 20.0 allows you to see what information is flowing via paths that are animated during model execution. In Activity Diagrams, the flowing item is displayed as a bubble with a label showing the item name. In diagrams based on a Composite Structure Diagram, a moving triangle is shown on an animated path as illustrated below.
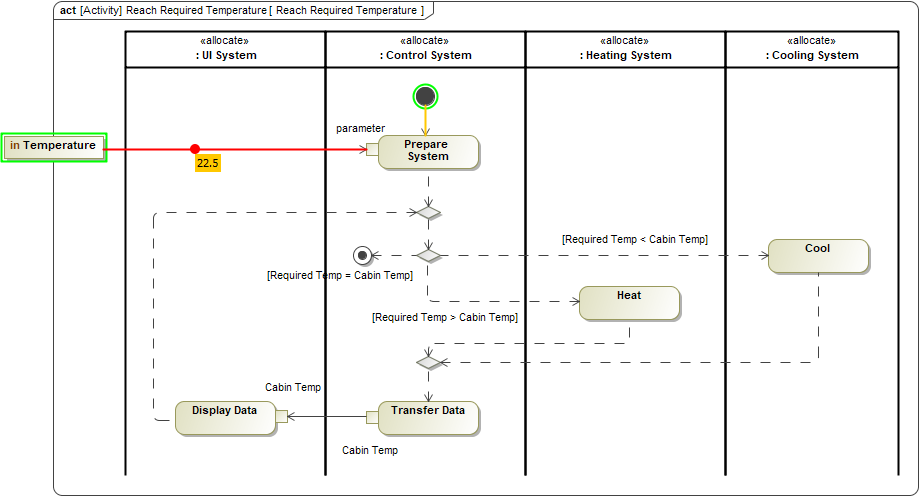
The temperature value flowing in an Activity Diagram.
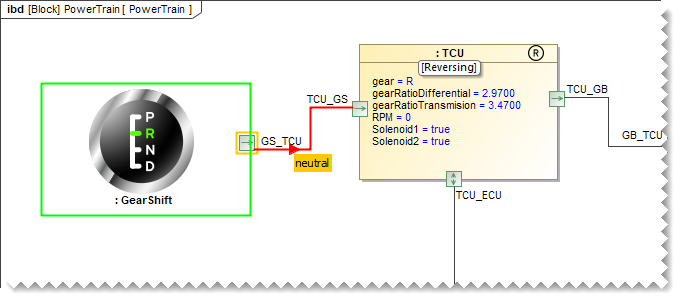
In this Internal Block Definition Diagram, you can see the neutral signal flowing from the GearShift to the Transmission Control Unit (TCU).
Sending a Trigger in Diagrams
Now sending a trigger during model simulation is even more convenient because you can do it right from a diagram without using the Simulation window. You can send a trigger directly from a Part shape in all diagrams based on a Composite Structure Diagram. When it is possible to send a trigger, a special button is displayed on a Part shape after selecting it.
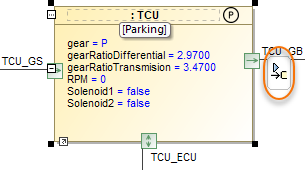
Simply click the highlighted button to send a trigger from a Part. If it is possible to send several triggers, the trigger list will be displayed for you to select from.
Reorganized Simulation Options
All Simulation options have been moved from Environment Options to Project Options for better user convenience, as it allows customizing simulation to fit a particular project. In addition, all simulation settings will be exchanged among users who collaborate on a server.
Furthermore, most of the Simulation Configuration options are duplicated in Project Options now, so you can specify default values for execution without using Simulation Configuration.
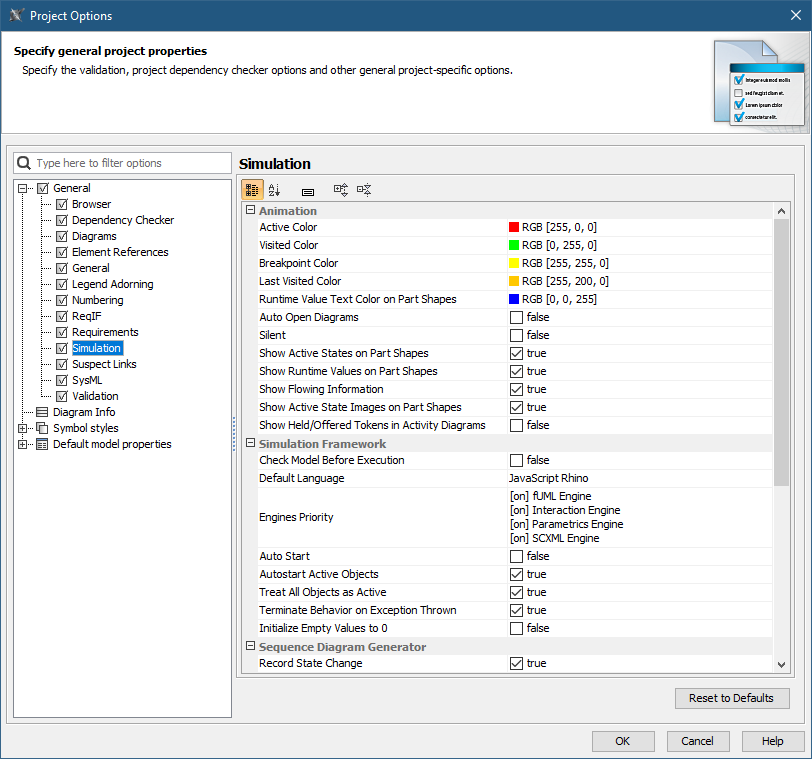
As you can see in this figure, all simulation options are now accessible in the Project Options dialog.
Animation Delay Logic
Animation delay affects only visible diagrams now. All closed diagrams and models run at full speed with no delays.
Interactive Guard Evaluation for STM and Sequence Diagrams
The guard conditions on transitions expressed in natural language cannot be evaluated, so the question dialog will be shown for you to choose. This behavior is consistent with decision nodes in Activity Diagrams.
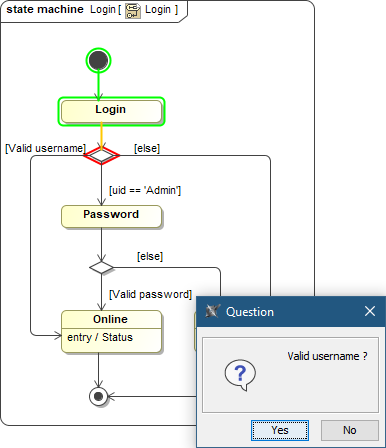
When simulating this State Machine Diagram, a user is asked to choose whether a user name is valid or not.
Simulink Co-Simulation in Activity Diagrams
A Simulink *.slx file can be dropped into an Activity Diagram to create «SimulinkBlock» Activity and Call Behavior Action for it. If the file is attached to your project or stored in the project directory, Cameo Simulation Toolkit will be able to execute it with given input values and provide outputs to the action output pins.
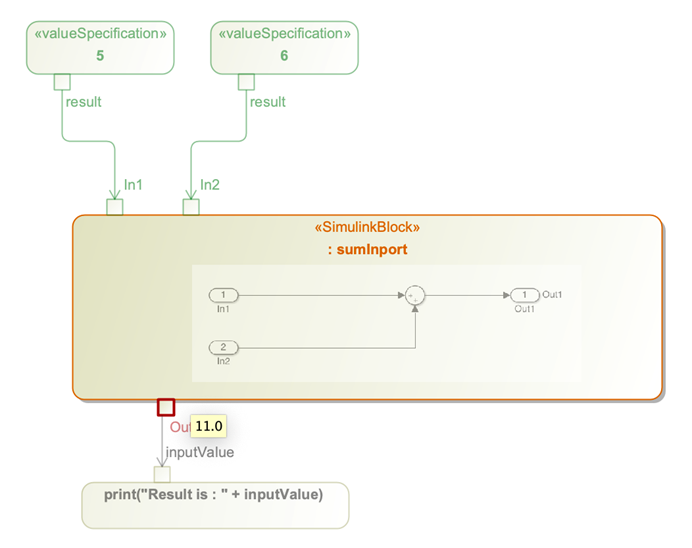
In this Activity Diagram, a «SimulinkBlock» action has been created from a Simulink *.slx file.
Other
- A new parameter -leaveprojectopen has been introduced into the command-line interface.
It allows leaving a project open for the next simulation if multiple property files are used in the simulation command. - Boolean and Enumeration values are represented in Timeline plots now.
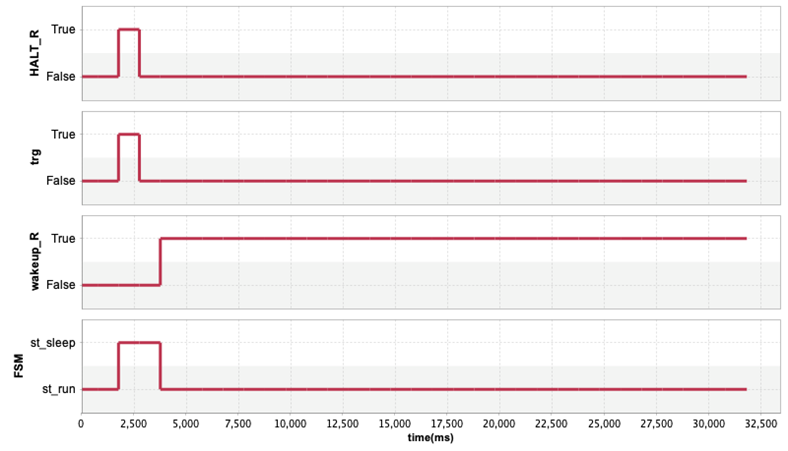
- A new Record Time option is added into CSV export configuration to be able to turn off the timestamp column when it is not needed, e.g., when recording Trade Study or Monte Carlo iterations.

Client-side Performance Improvements
Partial Data Loading in Tables
Experience enhanced table loading and scrolling performance! Thanks to the newly-introduced Load Partially mode, data is now loaded in only visible rows. There is no longer a need to wait until data is calculated in the entire table. Additionally, fast scrolling has improved; it is now considerably smoother.
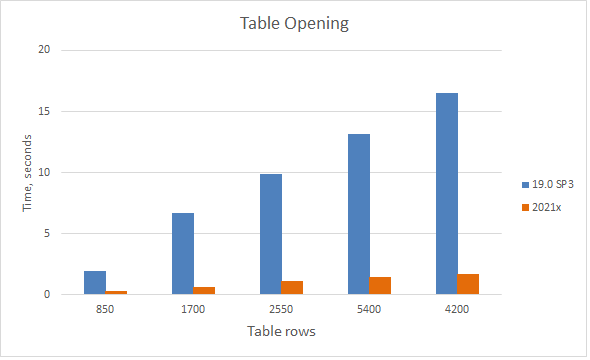
A chart comparing the opening time of Requirement Table having 7 standard columns with a different number of requirements.
Learn more about partial loading in tables >>
Increased Excel and CSV files Import Speed
The import performance of data from an Excel or CSV file into the modeling tool adds a great experience while managing a large scope of data. The data import time using the table sync feature is significantly faster compared with the previous version (19.0 SP4). Also, the data import using the new Excel/CSV Import dialog is even better in comparison to Excel/CSV Sync feature. The import of 61k elements takes only 2 minutes (see the chart below).
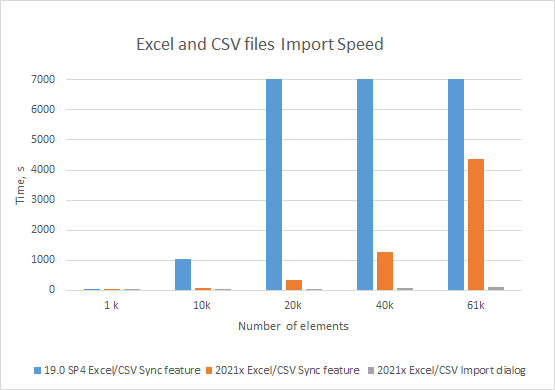
A chart comparing data import from Excel and CSV files using the Excel/CSV Sync and Excel/CSV Import dialogs.
Common Operations
- Copy/Paste. Now you can copy and paste data 2-4 times faster depending on the specific scenario.
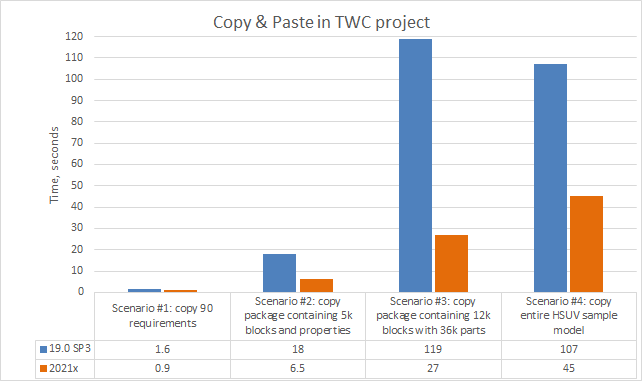
A chart comparing the copy&paste operation time in various scenarios.
- Find. The search speed in all texts has increased by 70-150% compared to 19.0 SP4.

A chart comparing the Find operation speed in 19.0 SP4 and 2021x projects containing 1M, 2M, and 5M elements (including used projects).
- Numbering. Creating the first numbered element, copying/pasting numbered elements, renumbering elements recursively, and updating the last element ID is now 30-840 times faster.
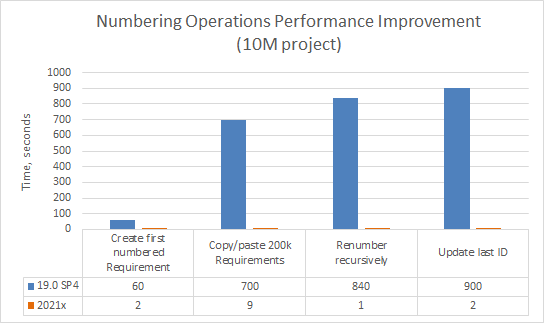
A chart comparing the Numbering operations speed in 19.0 SP4 and 2021x projects containing 10M elements (including used projects).
Element Selection. Now you can search and select the needed elements (e.g., in the Select Element and Quick Find dialogs as well as drop-down lists) approximately 40-50 times faster.
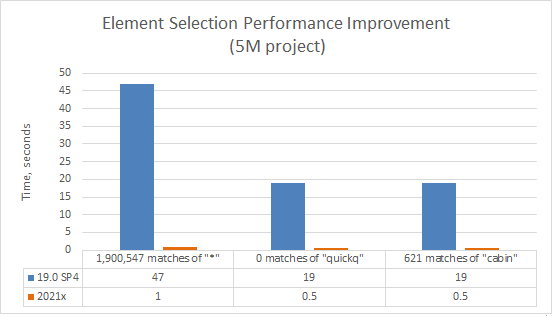
A chart comparing the element selection speed in 19.0 SP4 and 2021x projects containing 5M elements (including used projects).
- Validation. The active validation of the model now takes less than a second (0.8s after 5M project load and 0.5s after diagram load).
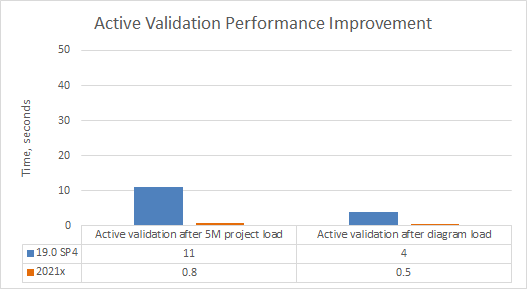
A chart comparing the active validation speed after the project and diagram load in 19.0 SP4 and 2021x projects containing 5M elements (including used projects).
Profiling Changes in the UML 2.5.1 Metamodel
Significant changes have been implemented in the UML metamodel for improved performance. The InstanceSpecifications, Slots, and ValueSpecifications are no longer used to store profiling data. Instead, new model element types and properties are introduced, while some have been removed (see the diagram below).
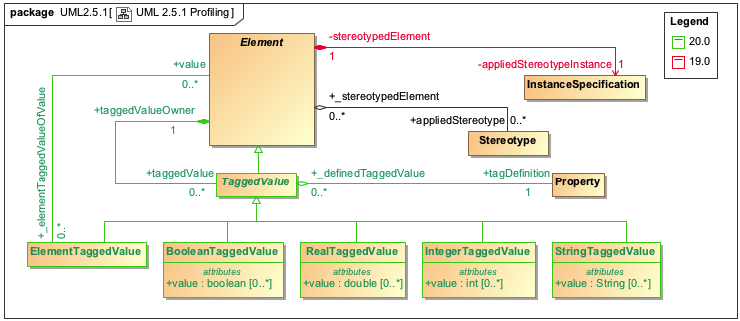
Profiling changes in the UML metamodel.
As shown in the figure above, Element references the TaggedValue that is used to specify the Boolean, Integer, Real, String, or Element values of the applied stereotype properties. This approach uses fewer model elements to store profiling data, which leads to a decrease in the total number of elements in SysML and UAF projects by 40-80%.
Note. Expressions based on the previously implemented profiling data storing metamodel no longer work, meaning that they have to be updated manually.
TWC-related Performance Improvements
Project Merge
Project Merge has undergone considerable performance improvements. The modeling tool version 2021x requires approximately 4-5 times less memory to successfully merge two server project branches, compared to 19.0 SP4.
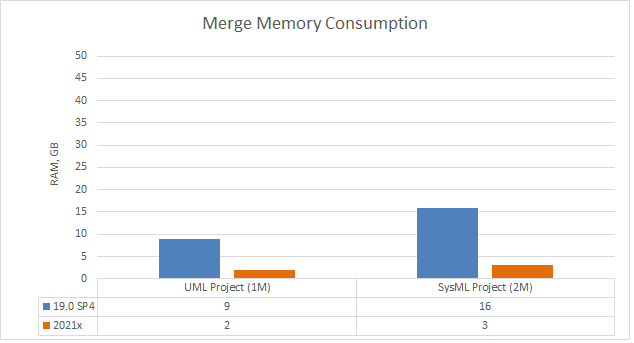
A chart comparing merge memory consumption in different modeling tool versions.
Furthermore, the merge operation speed has increased by 20-70% in 2021x compared to 19.0 SP4. Both frequent (between close project versions) and infrequent (between distant project versions) merges can now be performed much faster!
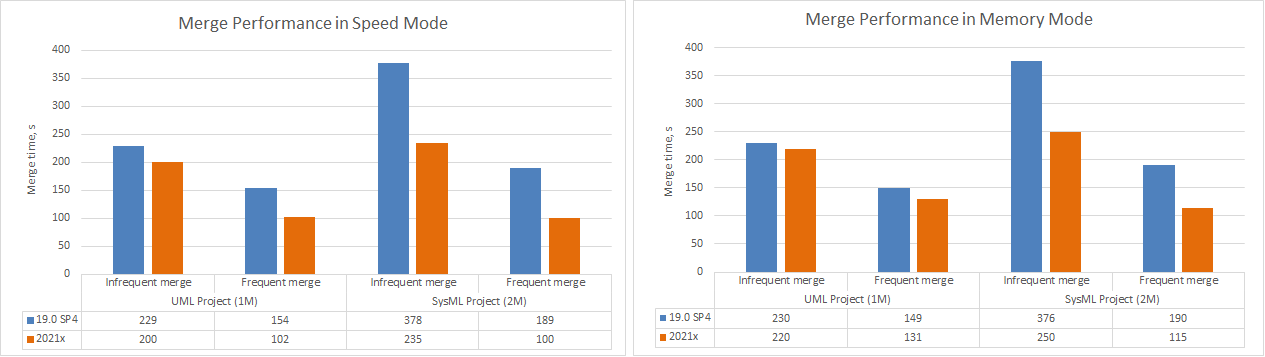
Charts comparing merge performance in Speed and Memory modes.
TWC Project Load
Project load memory and speed improvements have been implemented for Teamwork Cloud. The modeling tool now requires only 2GB of heap to load a 2M SysML project (first and second time) when working with TWC projects compared to 8GB in 19.0 SP4. Additionally, as a result of the UML metamodel changes, SysML projects are now opened 2-3 times faster.
Note. Received results cover the project load only, excluding validation, diagramming, and further modeling tool feature usage.
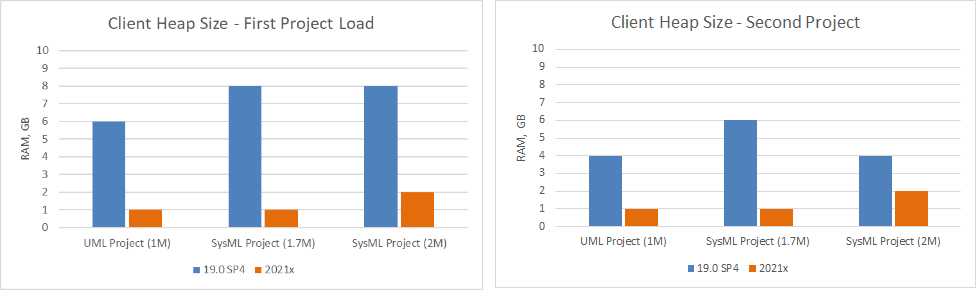
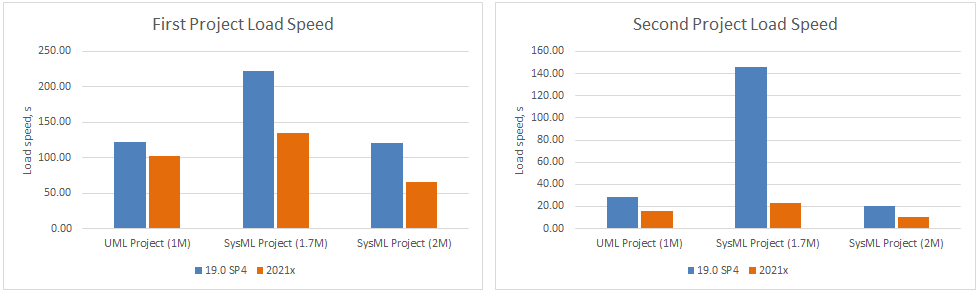
Charts comparing project load memory and speed improvements between different modeling tool versions.
- Three projects (sizes ranging from 1M to 2M) in 19.0 SP4 and the same projects in 2021x (sizes ranging from 750k to 1M) were used to run the tests.
- Migration time is excluded because projects that had already been migrated were used for testing.
TWC Save to Local
In 2021x, great attention is paid to the memory consumption improvements. Saving a Teamwork Cloud project locally now requires less memory. For example, a 2M SysML project now consumes only 4GB of RAM, compared to 20GB in 19.0 SP4.
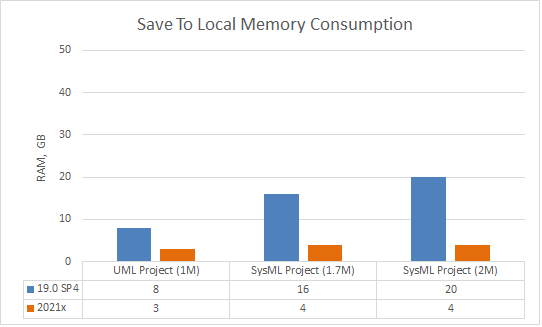
A chart comparing memory consumption when saving a TWC project as a local one between different modeling tool versions.
System Requirements
RAM and disk space requirements have been updated taking into consideration different sizes of large models. Learn more about recommended system requirements >>
| Project Elements Count (including used projects) | Allocated Memory2 | Disk Space | |
|---|---|---|---|
| Earlier versions | 2021x and later1 | ||
| 1.5 million | 1 million | 6GB | 6GB |
| 2.5 million | 2 million | 7GB | 10GB |
| 5 million | 3.5 million | 11GB | 30GB |
1 the project elements count is different due to the profiling data storing metamodel optimized in 2021x.
2 these memory requirements are indicative and may vary by project specifics.
Discontinued Products
The development of the following plugins is discontinued:
- Document Modeling Plugin (Model-based reports). For more effective model publishing and reviewing on the web, use Cameo Collaborator.
- To create Views and Viewpoints diagrams using the modeling tool with no plugins installed, use the Cameo Collaborator Publisher plugin or the SysML plugin instead.
- The DockBook Library Profile is no longer available.
- Methodology Wizard Plugin.
- QVT Plugin.
- Excel Import Plugin. We highly recommend using Excel/CSV Sync or Excel/CSV Import features instead.
- CSV Import Plugin. We highly recommend using Excel/CSV Sync or Excel/CSV Import features instead.
- LieberLieber Embedded Engineer plugin.
- Project Element Counter plugin.
- MBSE plugin.
- Document Modeling Plugin (Model-based reports). For more effective model publishing and reviewing on the web, use Cameo Collaborator.
- Web portal reports are no longer available. For more effective model publishing and reviewing on the web, use Cameo Collaborator. You can also use Web Publisher (Simple HTML) or Web Publisher 2.0 ReportWizard templates to generate HTML reports.
- WSDL Code Engineering and WSDL diagrams are no longer available.
- C# Code Engineering and C# Professional Edition are no longer available.
- CIL and CIL Disassembler Code Engineering are no longer available.
The News Reader (RSS) is no longer available. The notification at the right bottom corner of the modeling tool will inform you about the new version release instead.
- The no_install_mac.zip and 32-bit installation files are no longer offered for download.
- The Project Usage Map Profile is no longer available.
- The JavaScript Nashorn is deprecated with the intention of removing it. We highly recommend using JavaScript Rhino instead.
- The following 3rd party plugins are discontinued:
- Cameo Workbench
- Cameo Inter-Op
- ParaMagic Lite
- The following no cost plugins are no longer available in modeling tools:
- FAS. From now on, download it here: https://sourceforge.net/projects/fas4md.
- SYSMOD. From now on, download it here: https://sourceforge.net/projects/sysmod4md/.
From Teamwork Server to Teamwork Cloud
Teamwork Server is no longer supported in the latest release. Teamwork Cloud should be used as a product for collaborative modeling and model version control. Customers still using Teamwork Server must migrate their server projects to TWC 19.0 series first and then upgrade to TWC 2021x.
Learn how to migrate from Teamwork Server to Teamwork Cloud >>
From Cameo Collaborator for Alfresco to Cameo Collaborator for Teamwork Cloud
From version 2021x, Cameo Collaborator for Alfresco is no longer supported. We recommend using Cameo Collaborator for Teamwork Cloud instead.
Learn how to migrate your documents and comments from the Alfresco server to Teamwork Cloud >>
Collaboration
Detecting Changes in Diagrams During Merge
You can now specify in the Environment Options dialog whether to compare only the direct or all the changes in diagrams during the Project Merge and Project Comparison operations. By default, only the changes made by the user in loaded (open) diagrams are analyzed, leaving out unintentional diagram changes that occurred due to indirect changes in the model. This feature not only eases both merge and project comparison processes for the user, since the number of diagrams with changes is considerably reduced, but also optimizes modeling tool performance.
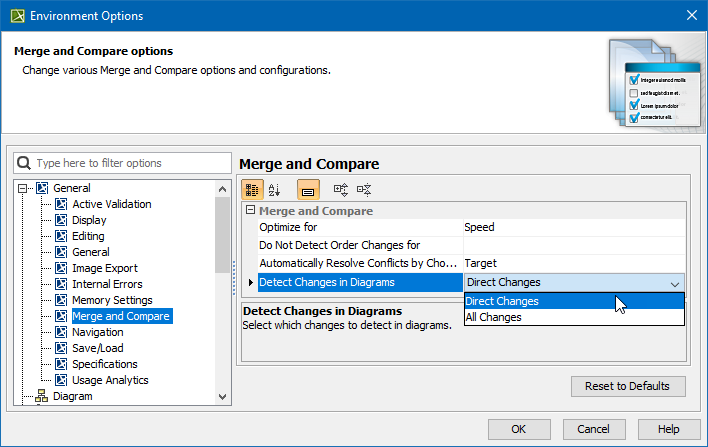
An Environment option to specify the changes to detect in diagrams.
Learn more about diagram changes in model merge and project comparison >>
Further Merge Usability Improvements
The model merge has undergone further usability improvements. From now on, changes from the Target and Equivalent Changes are automatically hidden by default; only the Source changes are shown. As a result, fewer changes need to be reviewed by the user.
Additionally, the model merge has been extended by adding a capability to select which ancestor calculation algorithm to use. You now have the freedom to choose a Branch Point as an ancestor for your merges. This is especially useful when merge results become too complex to understand and analyze due to previously rejected changes. By default, the Lowest Common Parent ancestor calculation algorithm is used.
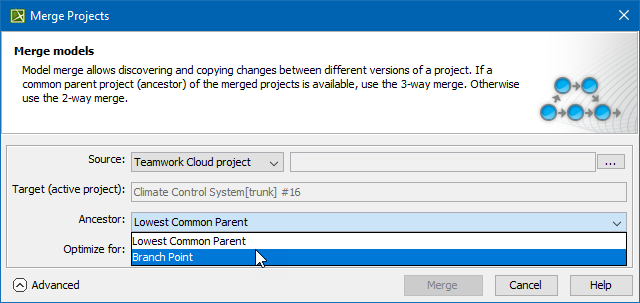
Selecting the ancestor for future merges in the Merge Project dialog.
Learn more about merge types in Teamwork Cloud >>
Other Features
Report Wizard
With a significant improvement in report generations for large-scale MagicDraw projects, Report Wizard 2021x has now been equipped to more efficiently generate reports using Web Publisher 2.0 templates of projects, with less time required and supporting more elements than earlier versions of the product.
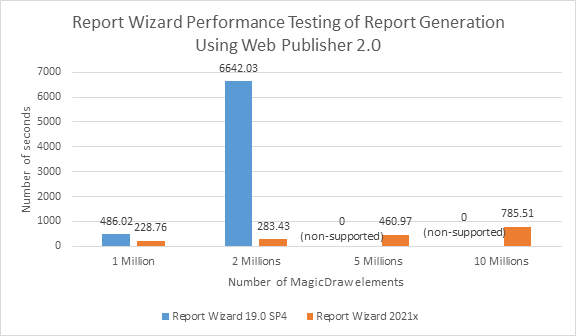
A bar chart displaying the performance testing of report generation from Report Wizard 19.0 SP4 and 2021x using Web Publisher 2.0.
- You can view the overall progress of generating reports deploying Web Publisher 2.0 through the progress bar and its displayed success percentage.
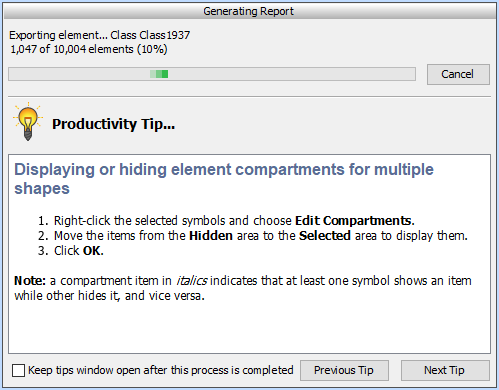
The progress bar with the success percentage shown above when generating reports using Web Publisher 2.0.
A more effective tool of the Document Report Designer diagram is now available for conveniently drafting and designing new extensive templates of the Microsoft Word Document (DOCX) format. Discover more about Document Report Designer >>
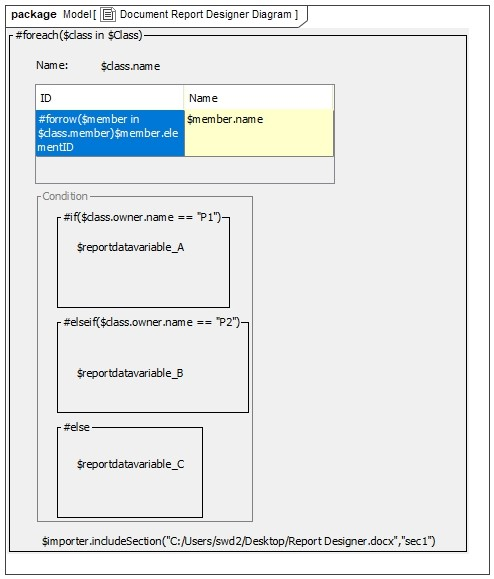
Document Report Designer for drafting and designing new templates of the Microsoft Word Document (DOCX) format.
An additional exclusive tool of the Presentation Report Designer diagram now makes it easier to create and design templates of the Microsoft PowerPoint Presentation (PPTX) format. Learn how to make use of Presentation Report Designer >>
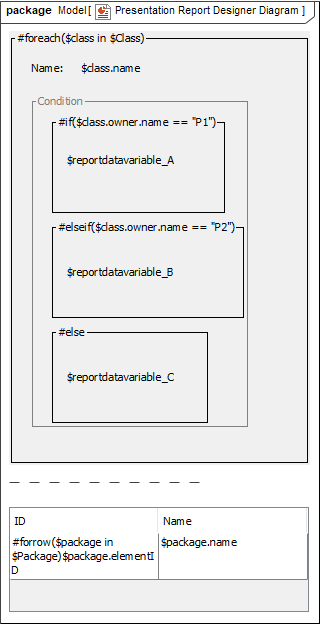
Presentation Report Designer for creating and designing new templates of the Microsoft PowerPoint Presentation (PPTX) format.
- With the Spreadsheet Report Designer provided in Report Wizard 2021x, you are now capable of effectively designing and generating Microsoft Excel Spreadsheet (XLSX) format. Find out how to use Spreadsheet Report Designer >>
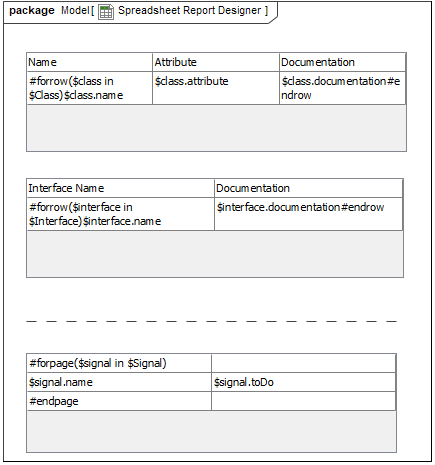
Spreadsheet Report Designer for designing and generating the Microsoft Excel Spreadsheet (XLSX) format.
Web Publisher 2.0 now has the Quick properties panel, at the lower left (similar to MagicDraw), to show the documentation settings in the Documentation tab and properties in the Properties tab of elements selected in the diagram and from the Containment tree. Learn more about the new Quick properties panel >>
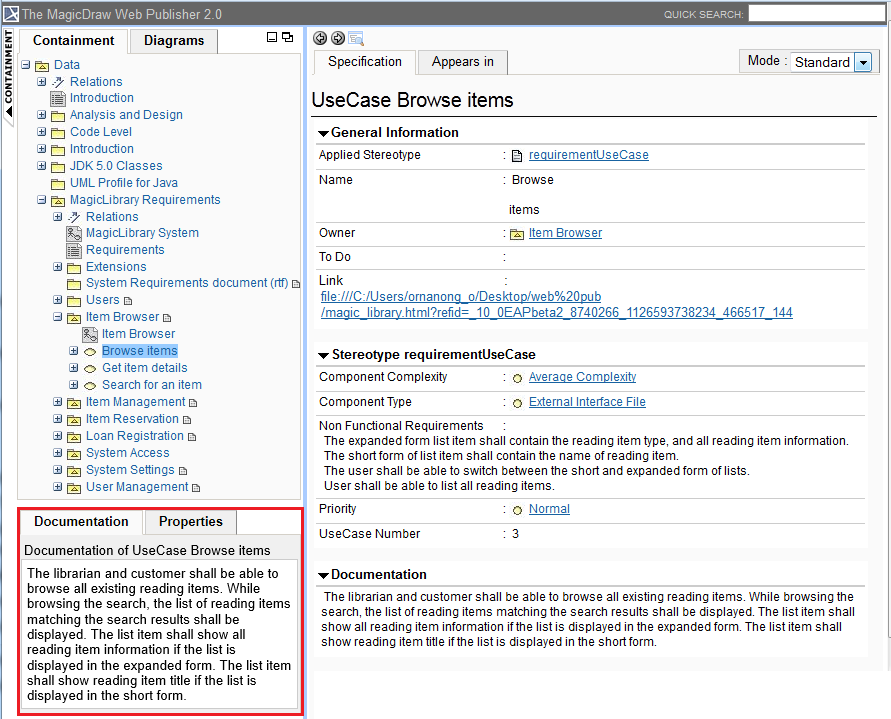
The Quick properties panel: Documentation and Properties tabs.
The capability of $report.isEmpty(obj) has been specially improved to check HTML String whether it is empty or not. Learn more about using this report tool >>
The multi-field sorter is now available as a function for sorting a collection of elements in ascending or descending order by deploying multiple sorting properties, rather than merely a single property as in previous versions. Find out more about the multi-field sorter >>
You can now sort elements by using a tag in applied stereotypes, regardless of being customized. Learn more about this capability of the sorter tool >>
You can utilize a new sorter function for sorting elements as they appear in the Containment tree. Discover how to use this sorter tool >>
- With a new option reducing XML meta-data file name length, the error of Web Publisher 2.0 files with lengthy names has been fixed. Know more about this report variable in Web Publisher 2.0 >>
- Single or double quotes can now be interchangeably used in both of the #includesection and #sectionBegin directives and $import.includeSection(templateName, sectionName) of the Import Tool.
- You can now access and list property objects (including DSL) classified in the PropertyGroup of customized stereotypes. See how the report tool works this way >>
- Reference bookmarks and their links can be created for DOCX numbered items. Learn about using these bookmark tools >>
- Functions for displaying lists of properties in property groups for given elements and stereotypes are ready to use. Learn how to use this group of report tools >>
Other
- The automatic UAF, SysML, and BPMN project migration has been enhanced. The projects are migrated silently and now no additional confirmation is required.
Key Issues Fixed
The following key issues have been fixed with this version:
Version news of servers and plugins
The latest Cameo Systems Modeler Documentation